The United States Crisis Monitor provides in-depth coverage of demonstration and political violence trends across the US in the lead-up to the 2024 presidential elections.
On this page, you will find monthly in-depth reporting on key election-related themes that explain how they may impact violence trends in the US. The interactive map allows users to visualize demonstration trends and extremist activity, singling out key states, themes, and groups. ACLED’s monthly Regional Overviews will likewise continue to provide an up-to-date outline of the most significant demonstration and militia activity.
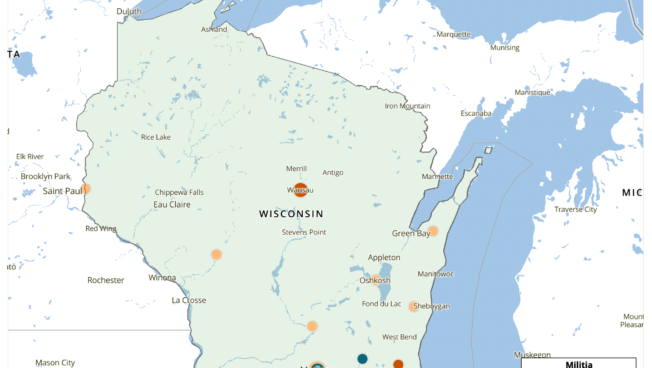
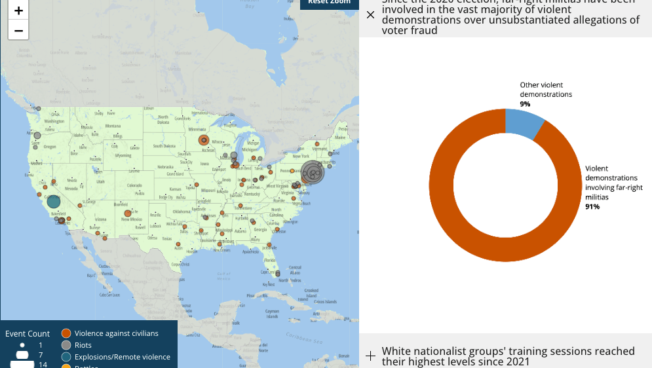
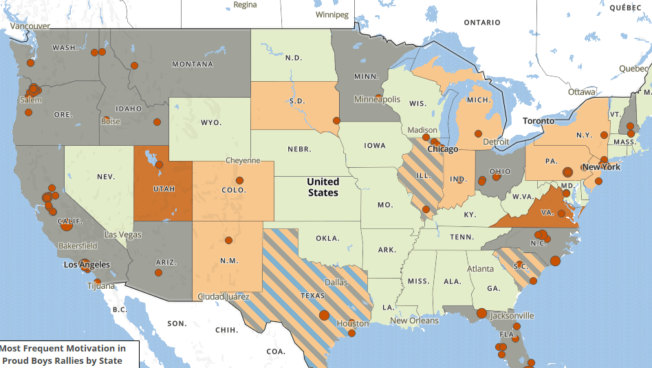
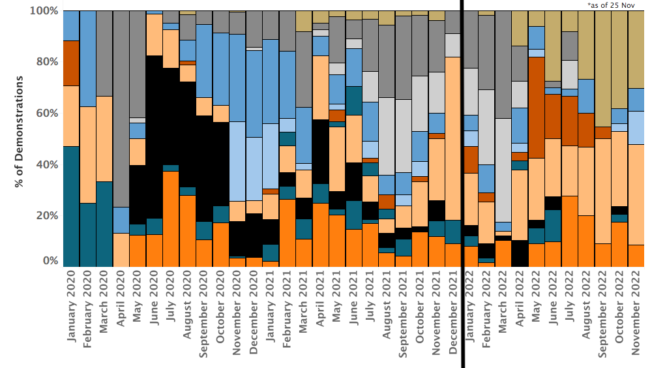
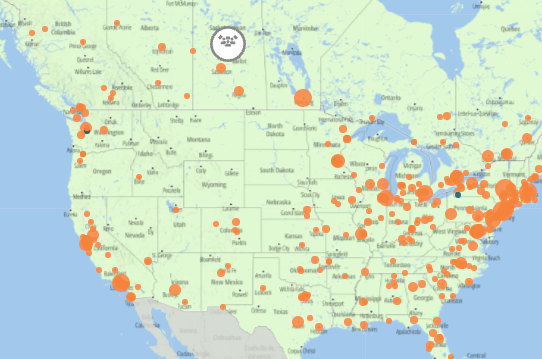
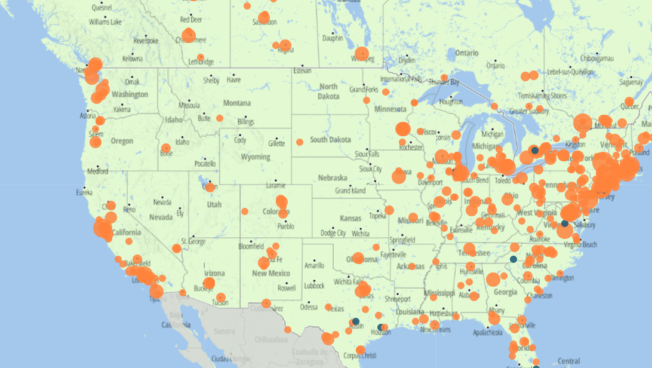
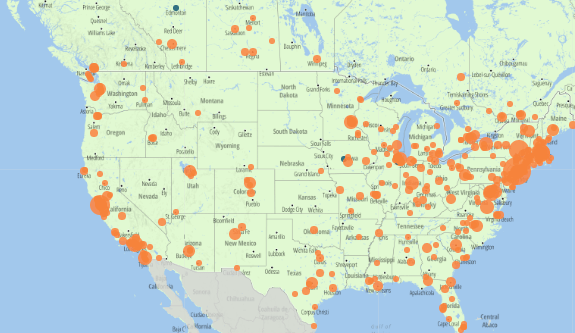
Use the tool below to see demonstration and extremist activity across the United States by event count and location. Filter the information by date range using the dropdown menus at the top right, and state by clicking on the map. You can further filter demonstration events by protest driver and extremist activity by group name using the dropdown menus. States and districts are colored according to the share of votes received by the winning party in the 2020 presidential election.
When looking at extremist activity view, the panel on the left provides a numbers breakdown per event type, and how many events involve far-right groups or other groups.
Note: ACLED defines ‘Strategic developments’ as contextually important events that may contribute to political disorder and/or may trigger future events. The inclusion of an event in the strategic development category is based on its significance in the context of disorder.
Our monthly analysis briefs break down the latest data on political violence and protest trends, highlighting potential early warning signs for closer monitoring.
We use cookies to optimize our website and our service.
Functional
Always active
The technical storage or access is strictly necessary for the legitimate purpose of enabling the use of a specific service explicitly requested by the subscriber or user, or for the sole purpose of carrying out the transmission of a communication over an electronic communications network.
Preferences
The technical storage or access is necessary for the legitimate purpose of storing preferences that are not requested by the subscriber or user.
Statistics
The technical storage or access that is used exclusively for statistical purposes.The technical storage or access that is used exclusively for anonymous statistical purposes. Without a subpoena, voluntary compliance on the part of your Internet Service Provider, or additional records from a third party, information stored or retrieved for this purpose alone cannot usually be used to identify you.
Marketing
The technical storage or access is required to create user profiles to send advertising, or to track the user on a website or across several websites for similar marketing purposes.