For three months from July through September 2019, ACLED conducted a pilot project to collect data on political violence and protest across the United States, setting out to identify the most prevalent forms of disorder and to establish comprehensive and consistent source lists for gathering relevant information. This report presents preliminary findings and lessons learned from the pilot project, providing a snapshot of the country’s evolving disorder landscape ahead of the 2020 general election.
Please find a full PDF version of the report here.
ACLED is currently seeking support to continue data collection for the US. If you wish to assist the project, please contact us at [email protected].
Key Points
The Project
- ACLED’s US Pilot Project collected data on thousands of political violence and protest events across the country from July-September 2019, including mass shootings and extremist violence, excessive force by police, non-state militia activity, mob attacks, hate crimes, and mass demonstrations
- The data are based on more than 900 individual sources, with over half of all events recorded during the pilot drawn from subnational or local sources
The Findings
- Preliminary data show nearly 3,200 political violence and protest events during the pilot period
- Political violence is limited, but lethal: almost 50 fatalities are reported, primarily due to mass shootings and excessive force by police
- The US is home to a vibrant protest environment: during the pilot period, more demonstration events are recorded in the US than in almost any other country in the ACLED dataset
- Demonstrations make up over 97% of recorded events
- The vast majority are peaceful, with fewer than 3% escalating into violence or facing police intervention
- Demonstrations are reported in all 50 states, ranging from a minimum of three in Wyoming to a maximum of 580 in California
- At least one demonstration event is recorded in over 700 counties – nearly a quarter of all counties in the US
Introduction
Over three months in the United States there were more than 3,000 political violence and protest events. Nearly 50 people were reported killed in politically motivated violence. Demonstrators took to the streets in all 50 states.
Reports suggest the situation is intensifying: hate crimes are on the rise (Washington Post, 13 August 2019), police brutality is increasing (The Appeal, 17 April 2018), and mass shootings are getting deadlier (LA Times, 1 September 2019). Many link these trends to the polarized political climate, and especially to the rhetoric of US President Donald Trump (Guardian, 28 August 2019; see also, Edwards & Rushin, 2018).
But what do these data show? Numerous data projects and initiatives exist across the US, each capturing a piece of the broad spectrum of disorder occurring around the country. Projects like the Gun Violence Archive track mass shootings; the various organizational members of Communities Against Hate track hate crimes against a wide swathe of identity groups; the Southern Poverty Law Center monitors the activities of extremist groups; the Washington Post has logged fatal police shootings; initiatives like Count Love and the Crowd Counting Consortium have been tracking demonstrations. There is no shortage of innovative data projects. However, no initiative has brought together all of these various forms of political violence and protest, under one methodology, to allow for a full picture of disorder in the US, as well as to allow for cross-country comparisons with other countries around the world.
For the first time, the Armed Conflict Location & Event Data Project (ACLED) has applied its methodology for real-time monitoring of political violence and protest to the US, providing a snapshot of the country’s evolving disorder landscape ahead of the 2020 general election. For three months from July through September 2019, ACLED conducted a pilot project to collect data on political violence and unrest across the country,1 setting out to identify the most prevalent forms of disorder and to establish comprehensive and consistent source lists for gathering relevant information.2
This report presents preliminary findings and lessons learned from the pilot project, concentrating on what political violence and protest activity look like in the US; the different trends identified over three months of data collection; the best sourcing strategies to capture the range of disorder; and the methodological challenges that emerged.
ACLED identifies two primary trends from the pilot data. First, violent events are rare in the US, but lethal. While organized political violence makes up only about 1% of the data, these events result in a relatively high number of fatalities – largely a result of mass shootings. Second, the US is home to a vibrant demonstration environment characterized by a large proportion of non-violent protests. Demonstration events make up over 97% of the data and the vast majority are peaceful protests, with fewer than 3% of events escalating into violence or requiring police intervention.
ACLED analysis of disorder in the US is necessarily limited by the narrow temporal scope of the pilot. Consistent coverage is needed to capture emerging trends in violence and protest across the country – a need that will only become more imperative as the US approaches the 2020 election. Preliminary findings from ACLED’s US Pilot Project cast light on what to expect going into this pivotal political juncture.
What is political violence and disorder in the United States?
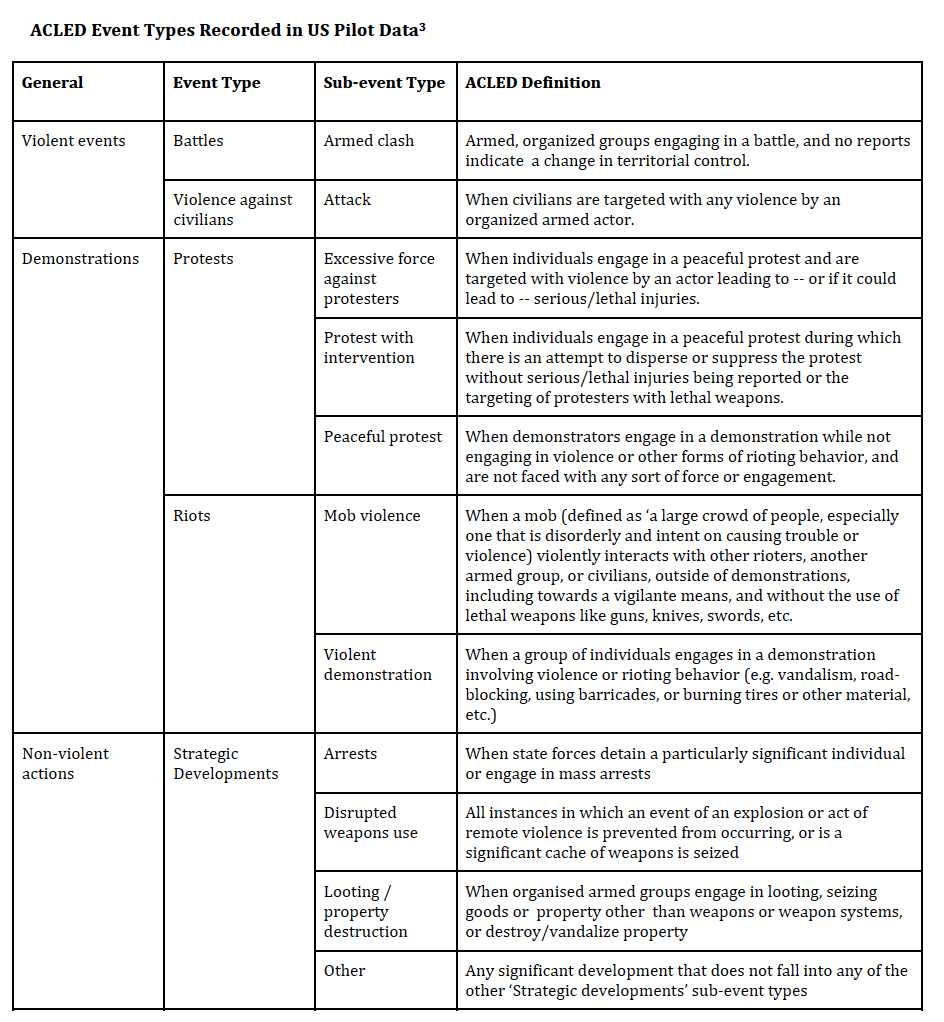
Political violence is not a globally uniform phenomenon. Politically violent events take different forms and vary in both their modality, magnitude, perpetrators, and targets. ACLED captures a wide range of events as it defines political violence as “the use of force by a group with a political purpose or motivation.” The intent of the definition is to include all forms of political disorder expressed through violence and demonstrations, within and across states. The collected events, across over 100 countries around the world, range from air strikes to mob violence, with the understanding that not every type of disorder is necessarily seen across every country (discussed in further detail in the ACLED Codebook). The types of disorder (event types and sub-event types) seen within the US context are detailed in the table below:
Through this understanding of political violence, ACLED aims to capture how states experience different levels and threats to public security, domestically, and transnationally.4 But definitions are important for what they include but also what they exclude: ACLED includes these events when their form, agents, modality, and motivations are comparable to the standards used to collect event data across the world. A standardized dataset cannot have one set of criteria for violent events in one context, and another set in a different place. In the context of the US, that means that some key decisions on excluding events are taken to reflect the political environment.
Mass shootings are among the events requiring careful methodological consideration (CBS, 1 September 2019). These attacks continue to occur disproportionately in the US (Vox, 30 October 2019), and are often perpetrated by individuals espousing extremist ideology, popularly termed ‘lone wolves.’ Although mental health issues or other personal motives may further fuel a perpetrator’s decision to commit such acts, many mass shootings conform to acts of terrorism that deliberately target specific groups with the aim of spreading fear and stirring a replication effect (Tilly, 2004). These mass shooting events are often claimed through manifestos which outline the perpetrator’s ideology and attest that, while operating alone, they seek wider recognition of their actions.5 Only those mass shootings that are designed to terrorize a population or specific group (rather than a personally connected target(s)) are included in ACLED’s pilot data. Elsewhere in the ACLED dataset, when political violence is perpetrated by unknown agents, these agents tend to be in a group, and are referred to as an ‘Unidentified Armed Group’ in the data. In the US, however, the most lethal cases of political violence are these mass shootings, which are often carried out by a single ‘lone wolf’ without an affiliation to a specific named group – and hence attributing such shootings to an ‘Unidentified Armed Group’ would not be accurate given the lone perpetrator of such events. As such, a new ‘unidentified actor’ category was introduced in the data within this US context: ‘Sole Armed Perpetrator’. This points to how definitions of political violence must be flexible to allow for accurate representations of political violence across varied contexts.6
In addition to mass shootings, excessive policing has exacted a significant toll on the population and the country’s trust in the security services. Excessive use of force by police and other state agents has attracted increasing attention and wide criticism from civil society and human rights organizations both across the US and abroad (Human Rights Watch, 22 October 2018). Concerns over the use of lethal force by police has led to the creation of groups like the Black Lives Matter movement, and encouraged the Obama administration to create a task force on policing in the 21st century (The President’s Task Force on 21st Century Policing, May 2015). According to some initiatives tracking fatal shootings in America, at least one thousand people – disproportionately hailing from minority groups and disadvantaged communities – die each year as a result of police shootings (Nature, 4 September 2019). In regards to these types of incidents, ACLED includes only those events where the details conform to our global standards of political violence. Policing is often particularly excessive towards select groups in the US (Vox, 14 November 2018), but much of this policing is within the bounds of the law.7 As such, only police engagements that are explicitly outside of established legal parameters are included, however unfair the existing constraints on police behavior may be.
Evidence suggests that US political violence typically takes several forms in addition to mass shootings and excessive policing discussed above. These include activities linked to non-state militias operating in both urban and rural contexts, especially those which consider themselves local security providers; violent mobs which seek to take justice into their own hands outside of state law (Vice, 21, February 2019); violence involving extremist groups, such as white nationalists or far right groups (New York Times, 3 April 2019); hate crimes against minority and vulnerable populations, such as women, LGBT+ groups, religious groups, race or ethnic groups, etc. (Washington Post, 13 August 2019); amongst others.
The presence of militia organizations has particularly constituted a source of instability since at least the 1990s, growing further since President Obama took office in 2008 (Southern Poverty Law Center, 2019). These militias serve typically different functions and follow different agendas, which range from supplanting the government in immigration control to pursuing self-government and protecting individual liberties from federal interference. Over the past three decades, clashes between militia organizations and federal agencies have resulted in several violent incidents, including the notorious 1992 shootout in Ruby Ridge, Idaho; the standoff with the Branch Davidians in Waco, Texas; and the more recent occupation of the Malheur National Wildlife Refuge in Burns, Oregon. Militia groups like the United Constitutional Patriots also patrol the US-Mexico border, detaining migrants without authority from the US government (CNN, 19 April 2019).
In addition to individually perpetrated mass shootings, extremist groups often described as white nationalists or supremacists have also been responsible for multiple acts of collective violence (Business Insider, 5 August 2019) – such as the lethal car attack against protesters at the 2017 Unite the Right rally in Charlottesville, Virginia (BBC, 13 August 2017).
Vulnerable populations, such as women; minority religious, ethnic or racial groups; as well as members of the LGBT+ community (USA Today, 1 July 2019), especially transgender individuals (New York Times, 27 September 2019), are also at risk of being victims of hate crimes (Forbes, 1 August 2019).
Beyond political violence, ACLED records hundreds of demonstration events in the US which include violent riots and peaceful protests. Notably, the latter can also face violence: excessive force against protesters, for example, involves violence against unarmed, peaceful demonstrators. ACLED includes these events, along with several other non-violent events (such as hate-fueled graffiti or other property destruction meant to intimidate), categorized as “Strategic developments,” in order to capture trends in unrest and possible precursors of political violence.
What is not included, per ACLED’s mandate?
While ACLED categories of political violence and protest include a wide range of violent and non-violent actions, as outlined above, ACLED does not record all instances of violence. Criminal violence, defined as violence that is motivated by personal or purely criminal motives, is excluded from the ACLED dataset, for example. Some mass shooting events fall into this category, such as the event in Dayton, Ohio on 4 August 2019 that resulted in the deaths of nine people; this event was not included as ‘political violence’ as the motives for the attack remain uncertain, yet are likely linked to personal dynamics given one of the victims was the shooter’s sister (Washington Post, 5 August 2019). Similarly, violence in the private sphere, such as domestic or interpersonal violence, is also not recorded in the ACLED dataset, even when these events could have wider repercussions among the public.
Similarly, events that are categorized as standard police enforcement are excluded from ACLED’s coverage. These typically include incidents where law enforcement agencies appear to have used violence within the bounds of the legal constraints on their activity, either in reaction to an attempt on the life of a police officer or otherwise in the presence of a threat. ACLED researchers consider whether the victim was, or claimed to be, armed at the time of the incident, and whether police were responding to a crime. In cases where law enforcement agents are reported to have used excessive force (i.e. using live ammunition against a visibly unarmed suspect), this is categorized as ‘Violence against civilians’ and is indeed included in the ACLED dataset. While the boundaries between what constitutes a legitimate or excessive use of force are often blurred, ACLED researchers will defer to the most conservative coding of violence against civilians, and unclear cases are therefore not coded as such.
ACLED only captures events that are reported to have actually occurred. As such, ACLED researchers do not record threats of the use of violence or intimidation. Non-physical violence, such as online or cyber-violence, is also outside of the scope of ACLED’s mandate.
Demonstrations – a group of three or more individuals – are only coded when they are directed against a policy, an institution, an individual, or other events and agents. Under these terms, political or party rallies, town hall meetings, and caucuses are not coded as ‘demonstrations,’ as they reflect regular political activity by members of political organizations, civil society, and the general public. Similarly, vigils that are not intended to manifest any protest message do not fulfil ACLED’s requirements for inclusion.
What is the source of information?
Data collection for ACLED’s US pilot relied on a source list of more than 500 source aggregators and websites, providing information on national and local events. More than 900 single sources were used to record conflict and protest events, all of which were reviewed on a weekly basis. More than half of all events recorded during the pilot project were drawn from subnational or local sources. A team of six ACLED researchers were assigned, on average, a list of 90 different media sources to monitor, covering six regions across the United States: Pacific, Mountain, Midwest, Northeast, South Atlantic and South Central. The breakdown of states per region is outlined in a table in the Appendix.
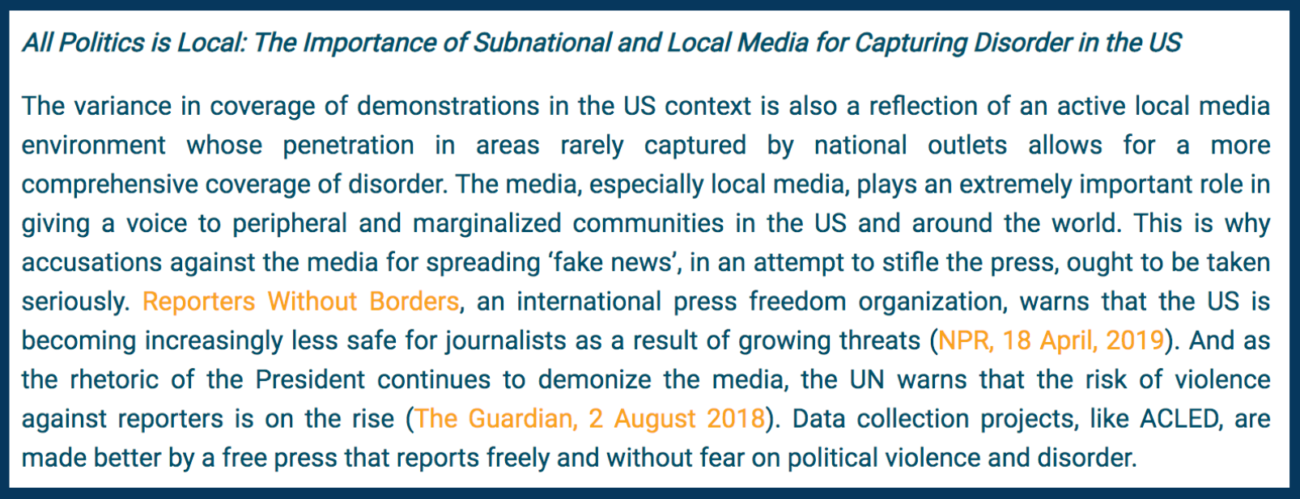
Due to a wide selection of county- and city-level media sources, as well as verified new media accounts and the official web pages of protest movements (for example, the website and social media accounts of “Lights for Liberty” rallies, which reported all events connected to the nationwide campaign), ACLED records events occurring in rural or remote areas which typically get little coverage in national media. For example, in Alaska’s northernmost boroughs and the sparsely populated counties of North Dakota and Texas, ACLED captures protest events linked to local grievances through the use of local media, which are best positioned to provide unique coverage.
Across the more than 100 countries that ACLED covers, ACLED draws on information from a wide variety of sources to use in coding data. These include traditional media, ranging from national newspapers to local radio; targeted and verified new media; reports published by international and non-governmental organizations; and data and information collected and shared by local partner organizations. To account for the different landscapes of both disorder and media across and within each country, ACLED develops tailor-made sourcing processes per individual context, where particular combinations of sources are constructed to approximate the reality of event occurrences and attribution.8 This comprehensive approach to sourcing makes ACLED better equipped than other datasets to capture the full spectrum of disorder happening within states relative to those data projects which focus solely on national-level media, given the biases of such media.
Preliminary trends, July-September 2019
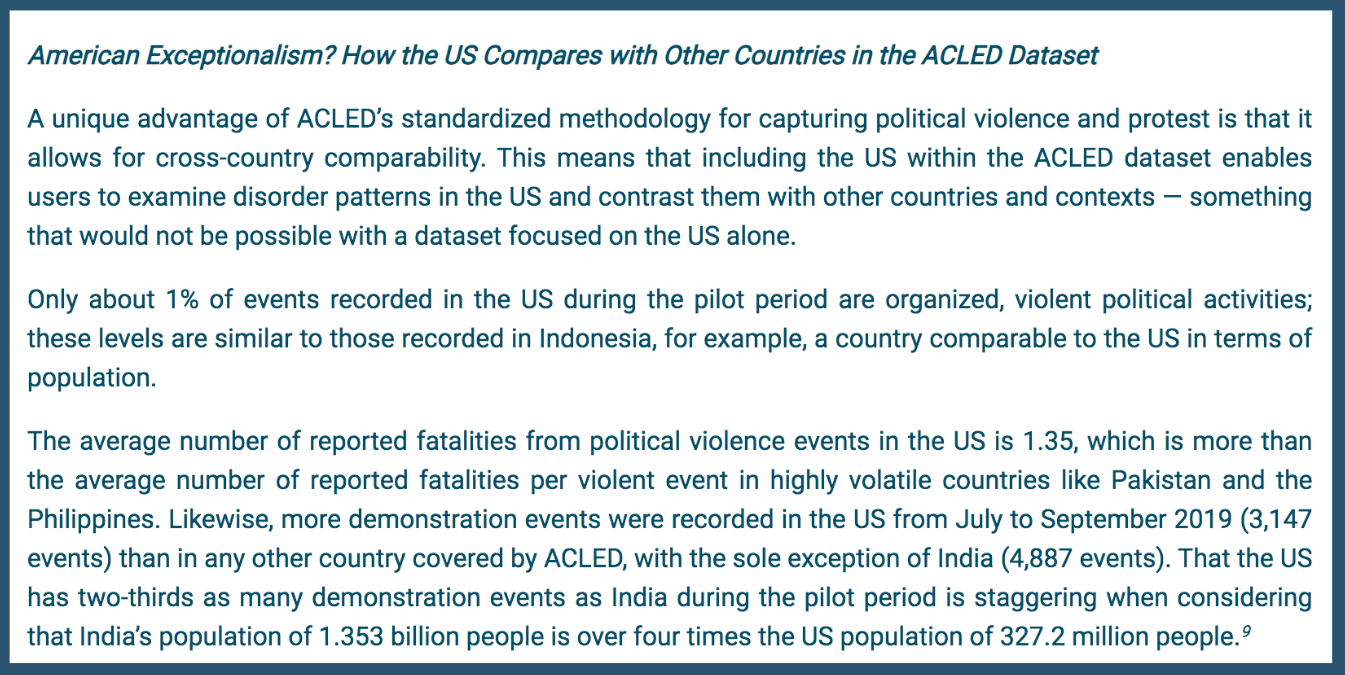
Between 1 July and 30 September 2019, ACLED recorded 3,195 political violence and protest events across the US, resulting in 47 reported fatalities. The data suggest two main trends: first, violent events are rare, but lethal. Only about 1% of recorded events are organized and violent political activities. Second, the US displays a vibrant protest environment characterized by a high number of peaceful demonstrations. Demonstrations make up over 97% of the data; the vast majority of these were peaceful, with fewer than 3% of events escalating into violence or requiring police intervention.
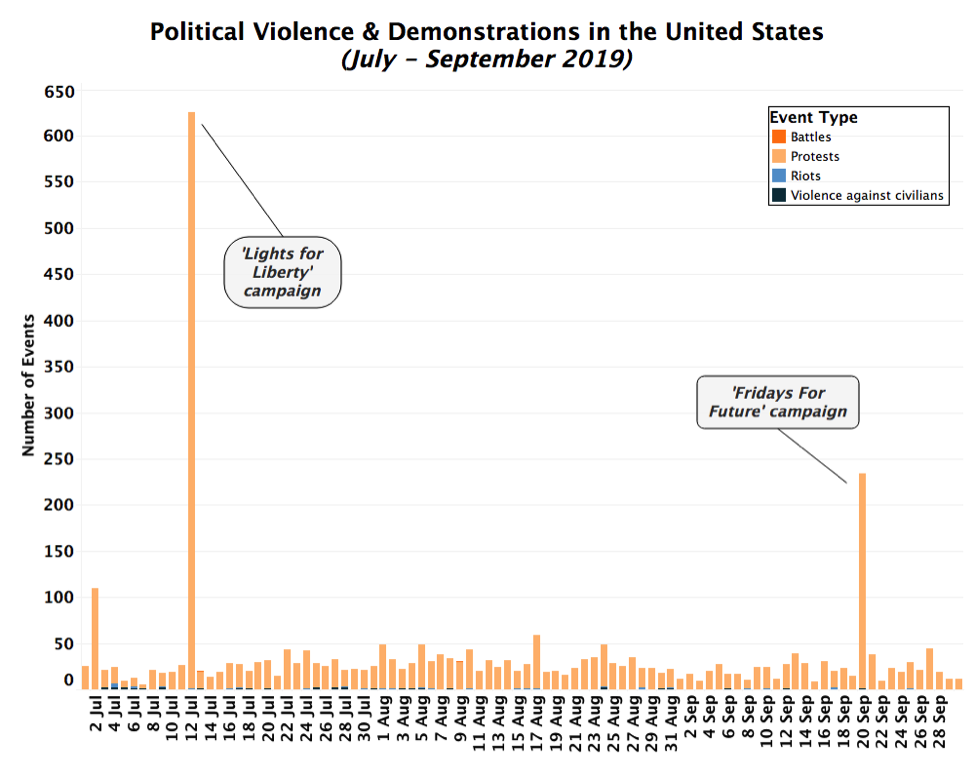
44% of the events took place in July, when protests linked with the “Lights for Liberty” campaign brought thousands of people to the streets. The “Light for Liberty” rallies took place on 12 July as part of a grassroots campaign to demand the closure of migrant detention centers, and involved hundreds of protest rallies across the country (see graph below).
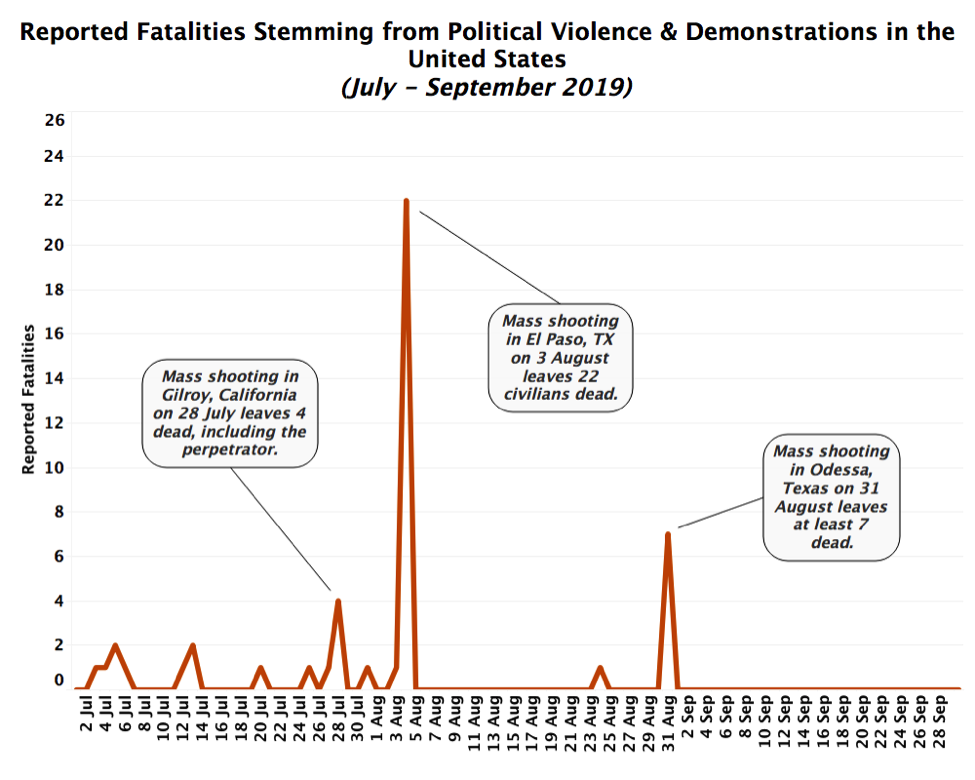
Spikes in fatalities are linked to mass shootings targeting civilians. While these mass shooting events constitute sporadic outbursts of violence, they are the reflection of a wider – and increasingly common – trend in the US (see graph below) (WTTW, 13 August 2019).
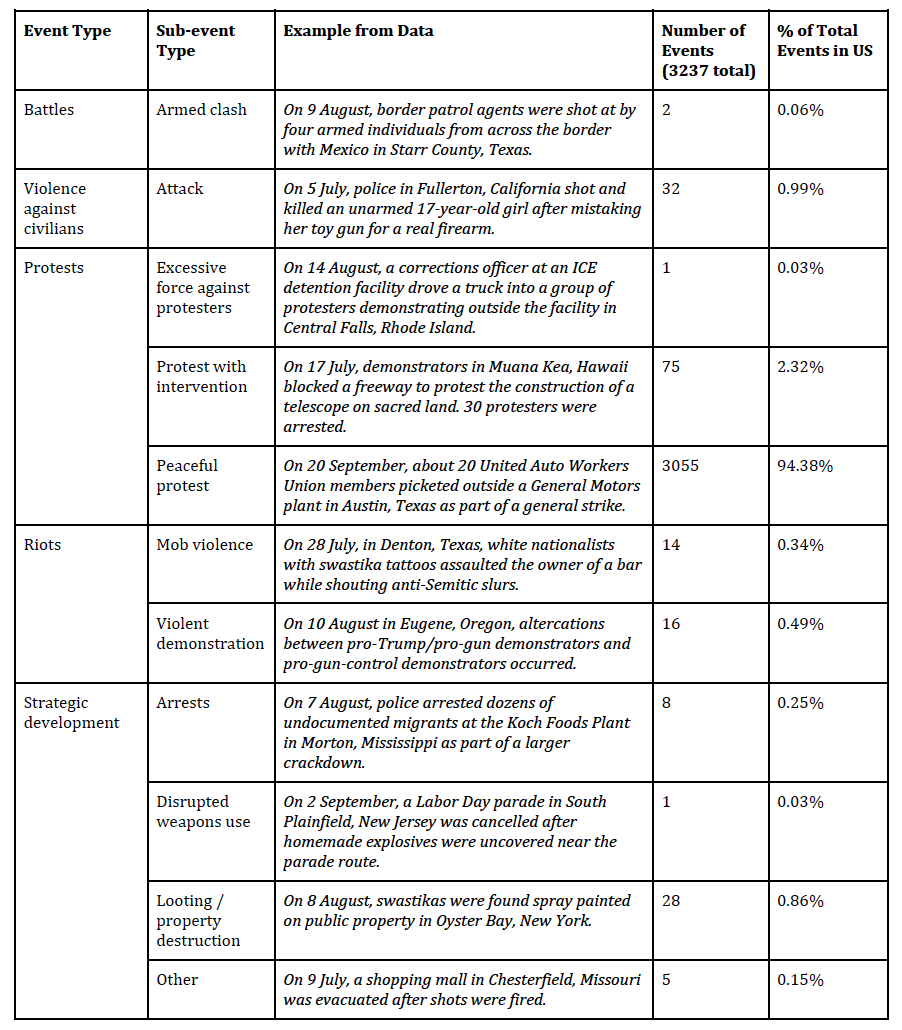
A complete breakdown of events by type is reported in the table below.
Limited but lethal: Political violence in the United States
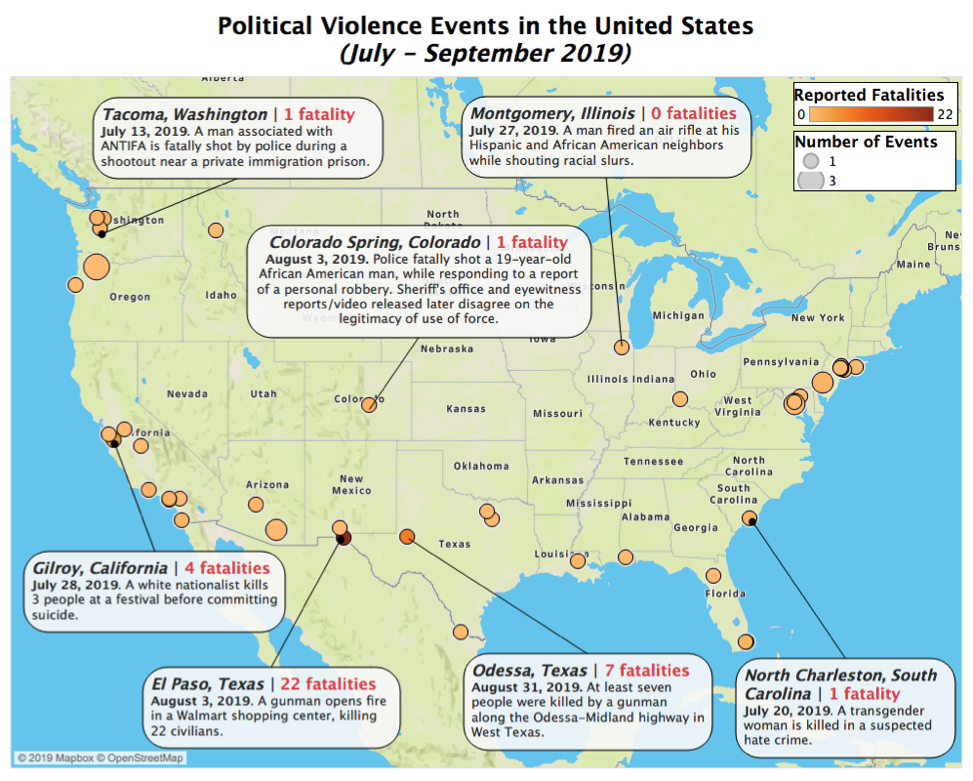
While the total number of political violence events occurring in the US is relatively limited, the overall lethality of these events is higher than in most countries covered by ACLED during the same period. This is largely due to the rise of mass shootings – the single most dramatic threat to civilian life across the US. These include events such as the 3 August shooting in El Paso, Texas, where a white nationalist opened fire inside of a Walmart shopping center, killing 22 civilians including eight Mexican nationals (The Guardian, 10 October 2019). As a result of this trend, political violence is not as widespread in the US as it is in other contexts around the world, but it tends to be deadlier when it does occur (for more, see inset box).
Though historical research indicates that the US is home to a variety of additional types of political violence, as outlined in the initial section of this report, not all of these event types were reported during the three-month pilot period.
Excessive force by police. The use of excessive force by police was reported in 16 events during the pilot period; these are especially prevalent against certain racial or ethnic populations (10 of the 16 events targeted racial and ethnic minorities). Four events involved the targeting of African-American civilians. For example, on 25 July in Port Allen, Louisiana, a state police officer shot and killed an African-American man to whom he was serving a warrant (WAFB, 25 July 2019). Likewise, on 3 August in Colorado Springs, Colorado, police fatally shot Devon Bailey, a 19-year-old African-American man, while responding to a report of a personal robbery. The sheriff’s office stated that Bailey allegedly reached for a gun before police shot him, and that a gun was recovered at the scene; however, according to eyewitness reports and a video later released, Bailey was running from the officer and did not reach for a firearm (Washington Post, 16 August 2019).
Other minority groups were also the victims of excessive force by police. On 13 July in Kirkland, Washington, police fatally shot an unarmed Hispanic man after he grabbed his girlfriend’s 18-month-old son and refused to let the child ago inside of a tent at a homeless camp (The Seattle Times, 13 July 2019). On 3 July in Poulsbo, Washington, police fatally shot Stonechild Chiefstick, a member of the Chippewa Cree Native American Tribe, at a Third of July fireworks show; police arrived on the scene after someone reported the individual was threatening those around him, though the man was reportedly armed with only a screwdriver (Kitsap Sun, 5 July 2019). It is unsurprising that ACLED records a particularly high number of events involving deadly use of force in Washington, as the state has “one of the United States’ most ironclad deadly force laws,” which extends broad protection from criminal prosecution to police officers accused of wrongdoing (Columbia Journalism Review, 17 October 2018; Washington State Legislature, Section 9A.16.040).
Non-state militias & violent mobs. ACLED records three activities linked to non-state militias or armed groups in both urban and rural contexts during the reporting period. In a more urban setting, on 13 July in Tacoma, Washington, an ANTIFA member threw incendiary devices at the Northwest Detention Center, a private immigration prison; he died after being shot by police after throwing the device (Buzzfeed News, 16 July 2019). In a more rural setting, on 9 August in a section of the Rio Grande river in Starr County, Texas, Customs and Border Protection agents were fired upon by four armed individuals across the US-Mexico border while patrolling (KTLA5, 9 August 2019). These militias or armed agents are not always formally organized. Violent groups may at times be spontaneously formed mobs who seek to take justice into their own hands outside of state law; 14 such events were recorded, largely occurring in mid-sized cities. On 12 July in Philadelphia, Pennsylvania, for example, a vigilante mob beat a man to death after he attempted to steal a car with three children inside (CNN, 12 July 2019).
Mass shootings & extremist violence. Five mass shootings qualifying as political violence were reported during the pilot period. In addition to the shooting in El Paso, Texas noted above, on 28 July in Gilroy, California, a 19-year-old white nationalist shot dead three people and injured another 16 at the Gilroy Garlic Festival before committing suicide (Insider, 30 July 2019). These two shootings also constitute extremist violence events in the US, as both of these examples were carried out by white nationalists. Other mass shootings, qualifying as political violence and hence recorded, include: the shooting on 27 July at Old Timers Day in Brownsville, Brooklyn, killing one and injuring elevent (The New York Times, 28 July 2019); the shooting on 5 August at a memorial vigil in Crown Heights in Brooklyn, New York, only two miles away from the Brownsville shooting of 27 July, in which at least four people were shot (NBC, 5 August 2019); and the deadly shooting on 31 August along the Odessa-Midland Highway in West Texas in which at least seven people were killed and 21 injured (New York Times, 31 August 2019).
Hate crimes.10 Hate crimes target minority populations. During the pilot period, seven attacks were reported against LGBT+ individuals, especially transgender women. On 7 July in Patchogue, New York, a man attacked a lesbian couple; the victims believed they were assaulted because of their identity (NBC, 17 July 2019). Later that month, on 31 July in Miami, Florida, a transgender woman was murdered (Local 10, 7 August 2019). On 20 September in Dallas, Texas, a man yelled homophobic and transphobic slurs at a transgender woman before shooting her multiple times (Dallas News, 4 October 2019). Three similar events were recorded in Oregon alone. On 24 August in Agate Beach, a homeless transgender woman was severely injured by a man at Agate Beach State Park in Newport for using the women’s bathroom (KATU 2, 30 August 2019). On 6 September, a transgender woman and driver for the taxi app Lyft was attacked by a passenger in downtown Portland; the passenger repeatedly hit her in the neck and head, before the driver was able to pull over and repel the man with pepper spray (NBC, 12 September 2019). The next week in Portland, a man attacked a trasngender woman and two friends, beating them multiple times (Advocate, 19 September 2019). Human rights organizations continue to highlight recurring violence targeting the LGBT+ community across the US (Human Rights Campaign, 2019).
In addition to events targeting the LGBT+ community, 14 hate crimes were also reported against other minority groups, with attacks based on religious affiliation, race, and ethnicity. For example, in events targeting religious groups, on 18 July in Queens, New York, a Hindu priest was attacked from behind by a man yelling “this is my neighborhood” before striking the victim with an umbrella, cutting the man’s face, and inflicting other injuries (CNN, 21 July 2019). On 25 July in Stanislaus, California, a priest at a Sikh temple was assaulted by a masked man who broke two windows and punched him in the face (Modbee, 26 July 2019). On 28 July at a North Miami Beach synagogue in Florida, a Jewish Orthodox man was shot and injured (NBC 6, 20 August 2019). In events targeting civilians based on race and ethnicity, on 4 July in Maricopa, Arizona, a man attacked an African-American teen playing rap music and stabbed him in the neck, claiming his music made him “feel unsafe” (Reuters, 10 July 2019). On 27 July, a man in Montgomery, Illinois fired an air rifle at his Hispanic and African-American neighbors while shouting racial slurs (Chicago Tribune, 8 August 2019).
Strategic developments. In addition to reports of political violence, a number of events involved strategic developments, which ACLED includes as events that are not violent, but may be the precursors to political violence. These include potentially sensitive arrests; for example, on 8 August in Springfield, Missouri, police were called after a man was seen walking through a Walmart shopping center with a rifle, days after the mass shooting in a Walmart in El Paso, Texas which left 22 dead (USA Today, 8 August 2019). Other examples include shots being fired without reports of harm, such as on 13 August in San Antonio, Texas, where reports emerged of a man shooting at buildings in the Immigration and Customs Enforcement (ICE) facility (New York Times, 14 August 2019). Other examples include property destruction, specifically related to hate speech, which could be an indicator of hate crimes to come. For example, in August in Elaine, Arkansas, unknown individuals cut down a memorial tree for one of the largest racial mass killings in US history. Destruction of the memorial is significant because of the gravity of the original event it honors: “[The massacre] occurred during the summer of 1919, when hundreds of African Americans died across the country, at the hands of white mob violence during what came to be known as the ‘Red Summer’. Estimates of how many African Americans were killed in Elaine range from the low hundreds to more than 800, which would make it the deadliest such massacre in US history. Mass graves are thought to be situated around the town” (The Guardian, 26 August 2019).
The map below illustrates the geography of all organized political violence events – battles and violence against civilians, specifically – recorded by ACLED during the three-month pilot period.
A vibrant protest environment
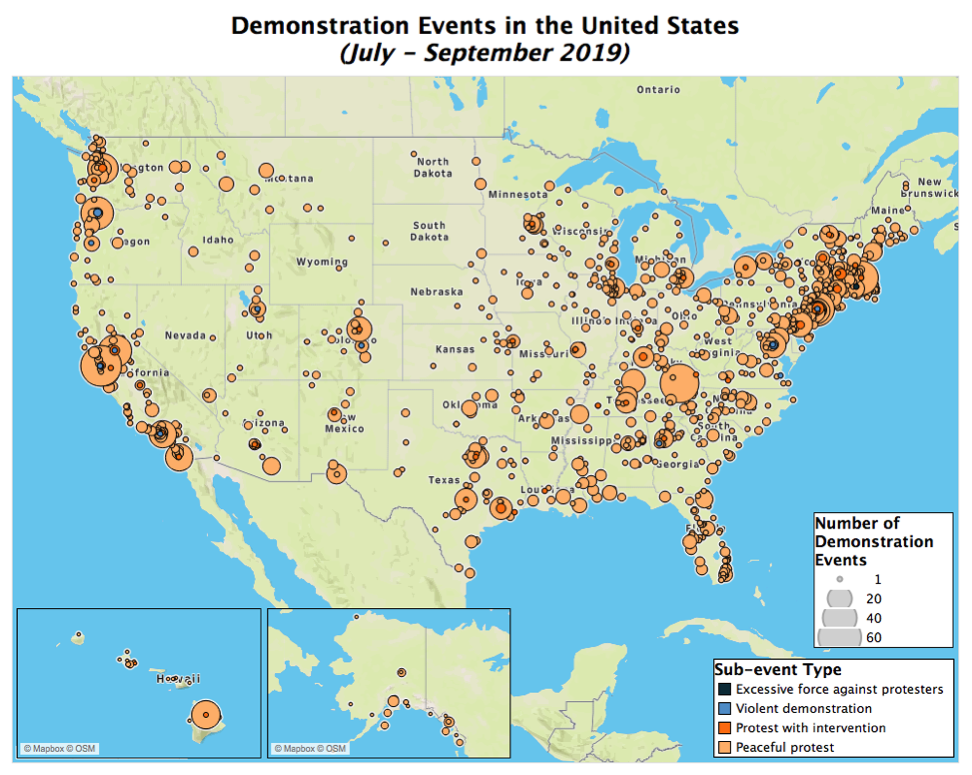
Peaceful protests without intervention make up most of the events recorded by ACLED between July and September 2019, and make up 95% of the events recorded during the pilot. Peaceful protests met with intervention make up 2% of all recorded events; these events are usually perpetrated by police. Only one case was reported during the three months that involved excessive force used against peaceful protesters: on 14 August, a truck exiting an ICE detention facility in Central Falls, Rhode Island, plowed into a group of protesters who had gathered outside the building (The Washington Post, 15 August 2019).
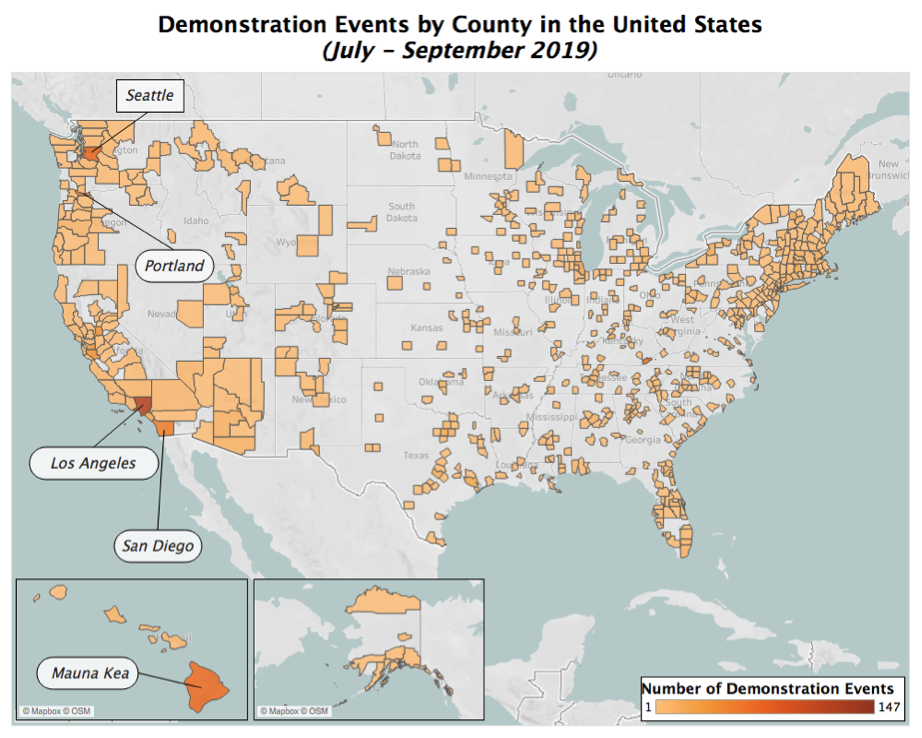
Demonstrations are recorded in all 50 states during the pilot period, with the distribution largely following population patterns. The number of demonstration events ranged from a minimum of three in Wyoming to a maximum of 580 in California (see map below).
During the pilot, 704 US counties registered at least one demonstration – nearly a quarter of all US counties – pointing to a dispersed geography of demonstrations across the country. Although higher protest activity is more likely in larger cities, these figures challenge the notion that protests take place only in urban metropolises; demonstrations also touch rural or sparsely populated areas across the country, either as part of large protest movements or, more frequently, as a reflection of local issues and grievances (see map below).
Ethnic minorities, students, migration-linked groups, and labor organizations tend to be among the actors most frequently engaged in protest activity. Most groups linked to protests are local in nature and scope, typically mobilizing around local issues or for a limited number of days, though at times generating sustained mobilization. Examples of such sustained movements include a two-month-long strike in Harlan County, Kentucky where coal miners protested from the end of July through September over unpaid wages after their company’s bankruptcy (The New York Times, 19 August 2019); a prolonged mobilization on Hawaii’s Big Island and among native Hawaiians across the US as locals opposed the construction of the Thirty Meter Telescope on the sacred Mauna Kea mountain (The Guardian, 17 August 2019); and a string of protests launched by the United Auto Workers organization in multiple states (mainly in Kentucky, Tennessee, and Texas) following failed negotiations with General Motors (Associated Press, 19 September 2019).
Some groups manage to sporadically mobilize demonstrators through nationwide campaigns or are able to sustain longer demonstration movements. Among these are the “Lights for Liberty” rallies, denouncing mistreatment in immigrant detention centers (The Washington Post, 31 July 2019), which made up 20% of all protest events recorded during the pilot; and the worldwide “Fridays For Future” student strike movement, calling for policies to counter global warming (The Washington Post, 20 September 2019; see also ACLED, 26 September 2019), which made up 9% of all protest events recorded during the pilot. Alongside these large campaigns, a number of environmentalist, religious, and other grassroots organizations also mobilized around the same issues, reflecting a composite civil society landscape. Nationwide protest campaigns are not limited solely to immigrant rights and the environment: national demonstrations frequently called for enhanced gun control (Deutsche Welle, 18 August 2019), with 153 events recorded; the resignation of Puerto Rico’s Governor, Ricardo Rosselló, over corruption charges (BBC, 25 July 2019), with 23 events recorded across the US, outside of Puerto Rico; as well as manifesting opposition to President Donald Trump, with at least 247 events recorded.11 Taken together, protest trends reflect a vibrant and diverse protest landscape, characterized by a multitude of national and local organizations and issues along which demonstrators mobilize. Demonstrations are not limited to urban areas but also take place in typically less active or populated states, which is captured in the data largely thanks to local media (see inset box).
Conclusion
Preliminary findings from ACLED’s three-month data collection pilot provide a rich snapshot of the US political violence and protest landscape. The data show that while political violence events are a rare occurrence in the US – especially when compared to conflict-affected contexts around the world – they are particularly deadly. Mass shootings, extremist violence, and attacks against minority communities are a clear and present threat to civilians across the country.
The data also confirm that the US is home to a diverse protest environment, with demonstrations reported in more than 700 individual counties across all 50 states. During the pilot period, the US had among the highest levels of demonstration activity of any country covered by ACLED. Though protests are largely peaceful, the data underscore the risk of violent interactions between demonstrators, the police, and opposing groups.
Nevertheless, analysis of disorder in the US is limited by the narrow temporal scope of the pilot project. Consistent coverage is needed to capture emerging trends in political violence and protest across the country – a need that will only become more imperative as the US approaches the 2020 general election and a predictably heated electoral campaign. Without sustained, reliable data collection, stakeholders and observers will remain in the dark on critical security threats, protest movements, and sources of violent instability going into a pivotal political juncture. Preliminary findings from ACLED’s US Pilot Project cast light on what to expect.
ACLED is currently seeking support to continue data collection for the US. If you wish to assist the project, please contact us at [email protected].
_____________________________
Notes:
[1] The pilot includes coverage of the 50 states as well as Washington, DC. Coverage of Puerto Rico will be included in ACLED’s coverage of the Caribbean, to be released by early 2020. The pilot was designed as an initiative to determine what an expansion to cover the US would entail in terms of source coverage, logistics and team management, and types of events.
[2] Violence and media landscapes differ across countries, so it is imperative to develop a unique sourcing profile when beginning data collection in a new context (for more, see this primer on ACLED Sourcing).
[3] Only the relevant event and sub-event types — i.e. those seen in the US pilot project — are included here; the full spectrum of ACLED event and sub-event types is much larger. For a full list of ACLED event and sub-event types, please see the ACLED Codebook.
[4] In some cases, violent actors may not articulate an explicit political agenda, yet they are still able to influence political decisions at the national and local levels — and this is why they are included within the dataset. For example, this is the case of several states in Latin America where criminal gangs and cartels may not have overt political goals yet are known to exert decisive political leverage, and control territory and populations.
[5] Because ACLED’s definition of political violence is limited to instances that affect public security as described above, ACLED only records events that are not instigated by purely personal, individual motives pertaining to the perpetrator’s own sphere as these are deemed to be criminal events. Rather, only events which are intended to spread fear and terror across society at large — or, in other words, impact public security at large — are included, per ACLED’s mandate. This is discussed in further detail in the following section.
[6] See page 22 of the ACLED Codebook for more on the coding of ‘Unidentified Armed Groups’.
[7] And these bounds can vary, with different levels of protections extended to law enforcement by state legislatures in addition to at the federal level.
[8] The landscape of conflict and disorder varies across and within countries, where the form, frequency, and intensity of disorder can differ. The media landscape also varies both across and within countries. Some countries may have a robust media environment where there is a free and open press, while others may maintain severe restrictions on journalism or impose internet shutdowns. Also, the media landscape is not necessarily homogeneous within an entire country: some subnational regions have active local media, for example, while others do not. In addition to these varied disorder and media landscapes, different sources of information can also have distinct biases. Some biases are very apparent; these include propaganda and misinformation – sometimes labelled ‘fake news’ – which might have an obvious strong right or left political orientation. Other biases, however, may be less apparent. For example, international and national media may be biased towards reporting larger scale events, such as lethal mass shootings or large-scale demonstration movements, while not reporting smaller scale events such as small protests (especially those affecting only small local populations) or events occurring in more rural environments. To account for these different landscapes and the various biases of sources within these landscapes, ACLED develops tailor-made sourcing processes per individual context, where particular combinations of sources are constructed to approximate the reality of event occurrences and attribution — which is what has been done in the US context here. In doing so, it is not the quantity of sources that is important, but rather the quality; more sources do not necessarily mean more reliable data because of sources biases. Simply increasing the number and types of sources will not account for these biases or produce more reliable data, but rather will perpetuate and magnify these biases. Instead, ACLED prioritizes the use of local sources, local partners, and subnational media.
[9] Population data comes from the United Nations Population Division.
[10] Hate crimes (often also referred to as bias crimes) are defined here as those which target a victim because of their (perceived) membership in a certain group based on race, ethnicity, nationality, religion, gender, and sexual orientation, amongst others. Categorization as a hate crime is dependent on who the victim of the event is. Extremist violence, on the other hand, is dependent on who the perpetrator of the event is. These perpetrators are those whose actions are spurred by extremist ideologies. As such, hate crimes are a form of extremist violence, in that targeting a victim based on membership in a certain group is a result of holding extremist ideology. However, not all extremist violence need be targeting of such victims and may be more indiscriminate in nature as well.
[11] Additional events involving opposition to Trump policies, for example, are not included in this count.


