Indian voters elected a new lower house of parliament (Lok Sabha) in the 2019 general elections, the largest democratic exercise in the world. Nearly 900 million people were eligible to cast their vote (Economic Times, 13 May 2019). Elections were spread out over seven phases scheduled over six weeks between 11 April and 19 May. Simultaneously with the general election, legislative assembly elections were held in Andhra Pradesh, Arunachal Pradesh, Odisha, and Sikkim. The Election Commission declared the results of the general election on 23 May. Incumbent Prime Minister Narendra Modi’s Bharatiya Janata Party (BJP) declared a resounding victory, expanding the party’s seats in the parliament and further solidifying Modi’s rule.
Over the past weeks, ACLED published a weekly infographic — the “Indian Election Monitor” — for every one of the seven election phases. This provided users with quick weekly updates based on political violence and protest data recorded by ACLED (for more on this, see the Indian Election Monitor for Phase 1, Phase 2, Phase 3, Phase 4, Phase 5, Phase 6, and Phase 7). This analysis piece serves to provide a final recap of the data recorded by ACLED during the general elections. All subsequent infographics showcase data from the day of the India Election Commission’s announcement of the election days – 10 March – until 25 May, the latest published data. The following analysis will focus on analyzing political violence and protest trends by 1) state, 2) event and sub-event type, and 3) actor involvement.
I. The Geography of Electoral Violence
Voters in India’s 29 states and seven union territories went to the polls over a six week period. The drawn-out process allowed for the provision of adequate security arrangements, especially in those areas prone to electoral violence, such as Jammu & Kashmir, West Bengal and Uttar Pradesh (for more on this, see this past ACLED piece). In most states, voting was completed in one phase, while voting in several states was spread out over two phases (Karnataka, Manipur, Rajasthan, Tripura), three phases (Assam, Chhattisgarh), four phases (Jharkhand, Madhya Pradesh, Odisha, Maharashtra), five phases (Jammu & Kashmir) or seven phases (Bihar, Uttar Pradesh, West Bengal).
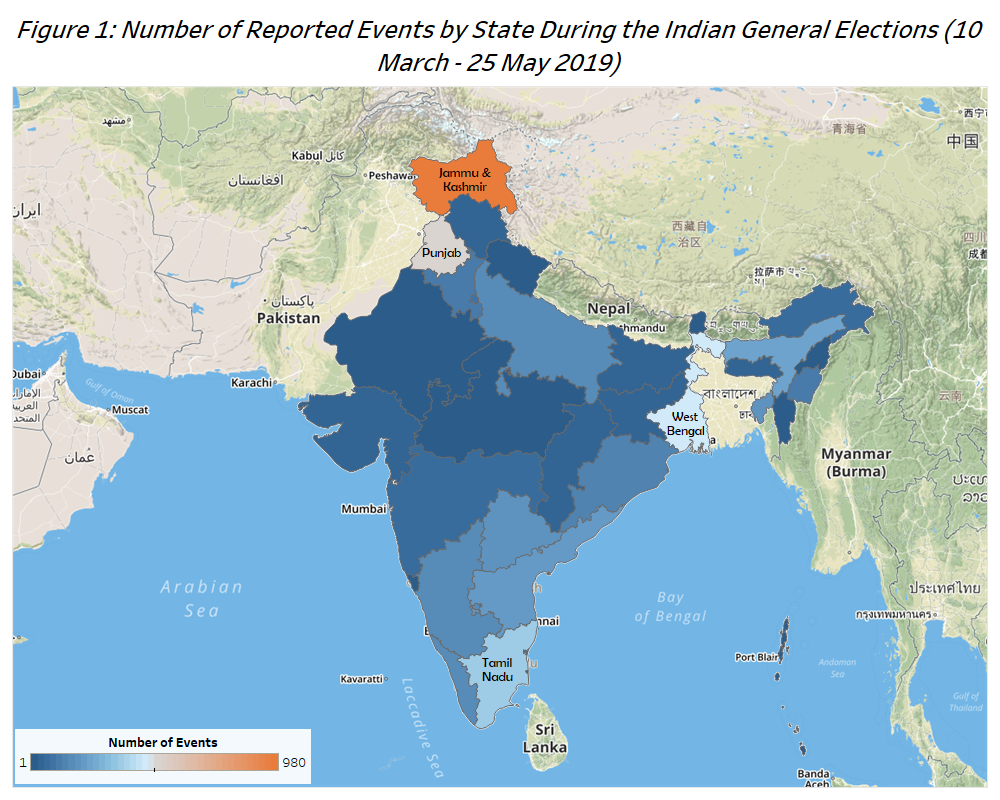
The map below in Figure 1 depicts the number of recorded events by state and demonstrates that the number of recorded events in Jammu & Kashmir (980 events) is almost double the number recorded in Punjab (502 events), the state with the second highest number of recorded events. The states of West Bengal (461 events) and Tamil Nadu (368 events) rank third and fourth respectively.
ACLED records 327 reported fatalities across India between 10 March and 25 May. Figure 2 breaks down the number of reported fatalities by state and event type. The donut chart in Figure 2 below shows that the most reported fatalities stemmed from acts of violence against civilians (in orange), closely followed by deaths resulting from battles (in black).
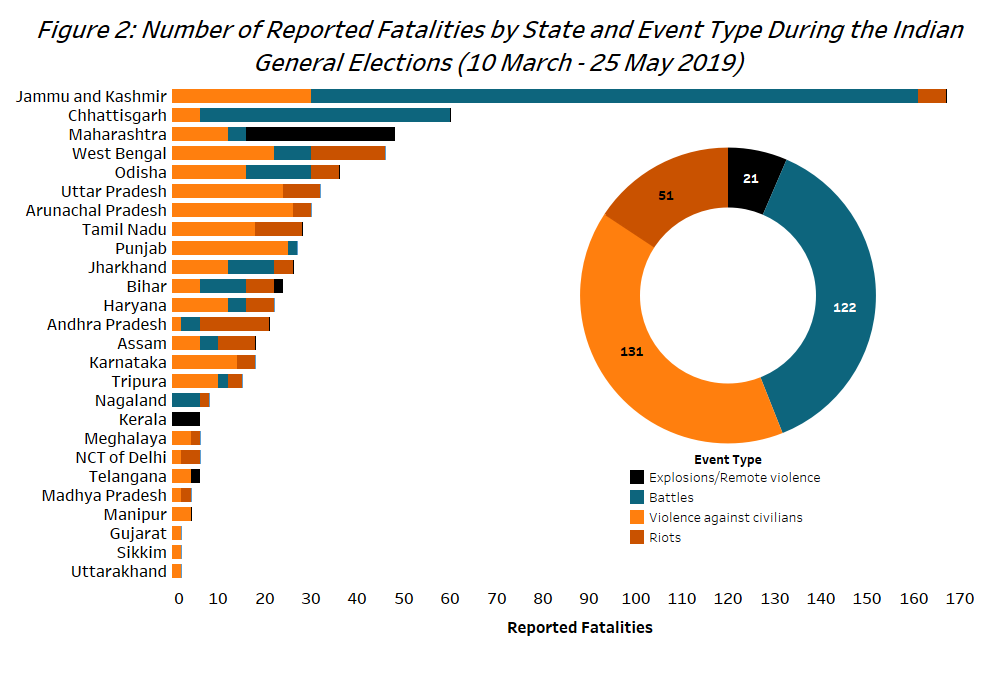
Meanwhile, political rivalries in West Bengal, especially between the Trinamool Congress Party (TMC) and the BJP, were the main cause of reported fatalities. Political parties in West Bengal have a long history of violent competition. This is by far not a new phenomenon connected to the rise of the TMC and more recently the BJP but stretches back decades to the Communist state government (India Today, 16 May 2019). The generally charged political environment in the state further explodes during election periods with murders, clashes, firing, rioting, and arson being reported amidst rally after rally (for an analysis of local elections in West Bengal in 2018, see this past ACLED piece).
II. An Anatomy of Electoral Violence
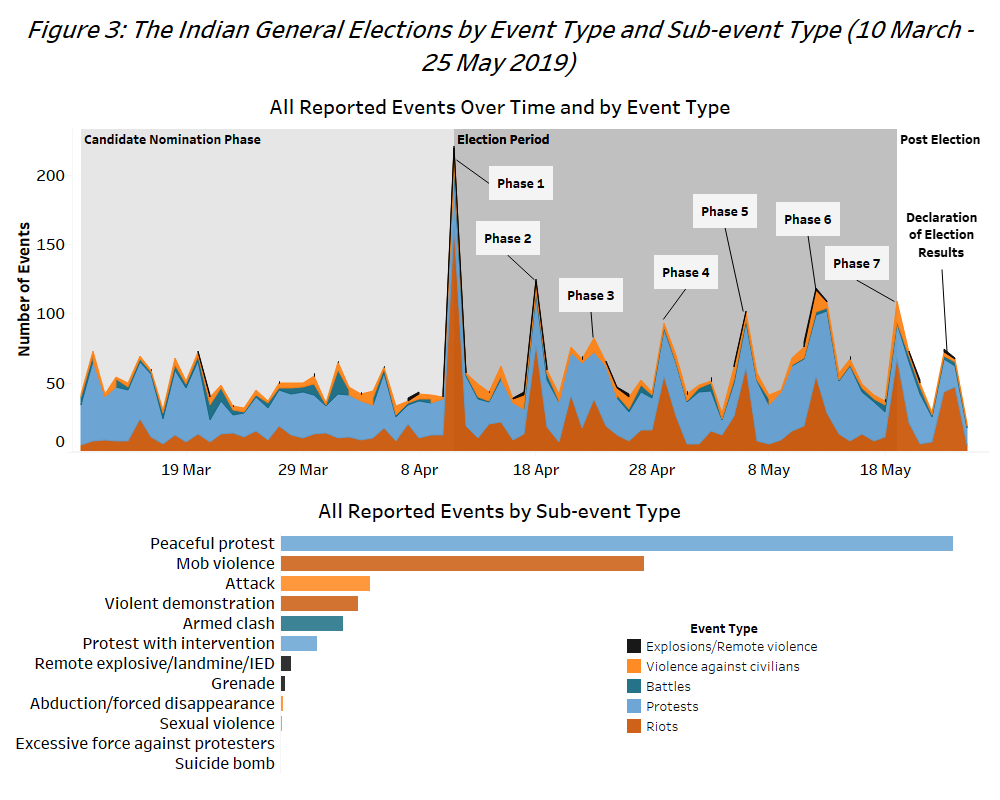
The period around the general elections can be divided into three periods: 1) the candidate nomination period following the announcement of the election dates, 2) the election period and 3) the post-election period. The first half of Figure 3 below shows the reported events by event type over time, while the lower half depicts the number of reported events by sub-event type.
With regard to the timeline, protest (in blue) and riot (in brown) events were the main event types during the candidate nomination period. Demonstrations and inter-party clashes during that period were typically fuelled by disappointed potential candidates and their supporters, who did not receive their parties’ nomination. The number of recorded events increased during the election period overall and significantly spiked on the election days, as depicted in the top area graph above. The highest number of events was recorded on the first day of voting, while comparatively lower event numbers were recorded on the third day. Riot events significantly spiked on each day of voting while no clear patterns are visible for other event types. During the post-election period, the declaration of the election results on 23 May led to a spike in recorded incidents of post-electoral violence including clashes among supporters of various parties and targeted attacks against rival candidates and voters.
With regard to the recorded sub-event types (depicted in the lower half of Figure 3), peaceful protest and mob violence events are the most commonly reported events. However, the weekly Indian Election Monitor demonstrated that, when doing analysis focusing on specific election phases, the most commonly reported sub-event type was actually mob violence during all phases but Phase 4. This overlaps with the timeline showing a spike of riot events on election days. Typically supporters of political parties clash with their rivals, vandalize polling stations, or clash with security forces. Incidents of mob violence on election days are common across India with the highest numbers recorded in West Bengal, followed by Jammu & Kashmir, Tripura, and Andhra Pradesh.
III. The Actors Behind Electoral Violence
A multitude of actors contribute to electoral violence in India (for more on the conflict dynamics in India, see this past ACLED piece). Rebel groups are active in many Indian states, including Kashmiri separatists in Jammu & Kashmir, left-wing extremist Naxal-Maoist rebels in central-west India, and various rebel groups in northeastern India. Rebel groups often engage in the electoral process, calling for boycotts and targeting political candidates and security forces tasked to provide security during the election. Political parties are the main actor engaged in electoral violence. In most cases, these actors engage only in mob violence but occasionally political militias engage in armed battles or launch targeted attacks against their rivals.
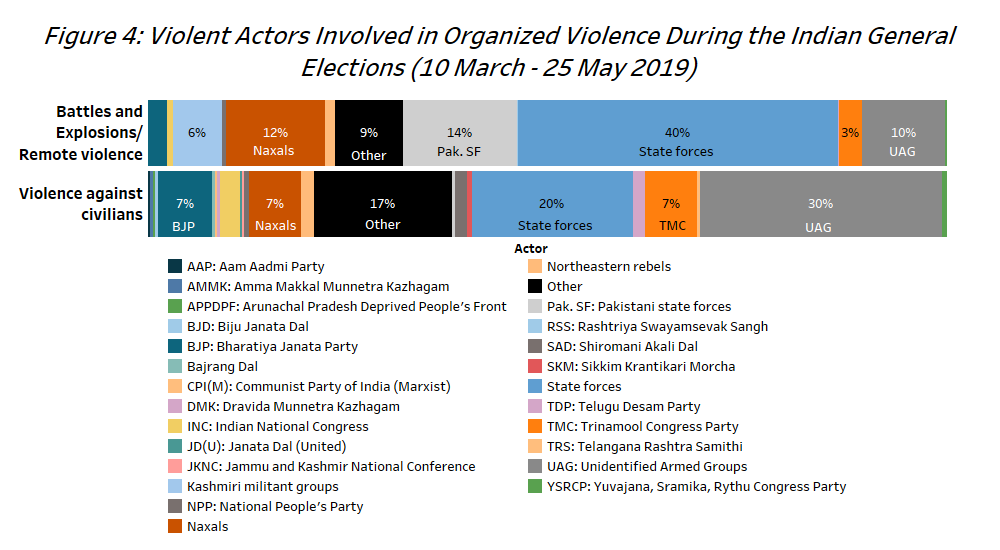
Figure 4 below shows the participation of violent actors in battle events and events of explosions and remote violence, as well as acts of violence against civilians. Only the most active actors are identified by name below.
With regard to rebel group involvement, left-wing extremist rebels (identified as ‘Naxals’ in brown above) were the most active out of all identified rebel group actors, with 84 recorded organized violence events. The various militant groups active in Jammu & Kashmir (in light blue) were responsible for 31 events while members of various northeastern rebel groups (in tan) were active in 11 events of organized violence. Members of TMC (in orange) and the BJP (in teal) have been most frequently involved in organized violence events, especially in targeted attacks against civilians. The conflict between Indian and Pakistani security forces also continued over the course of the general elections, with Pakistani security forces (in light grey) involved in 14% of the recorded battle and explosions and remote violence events.
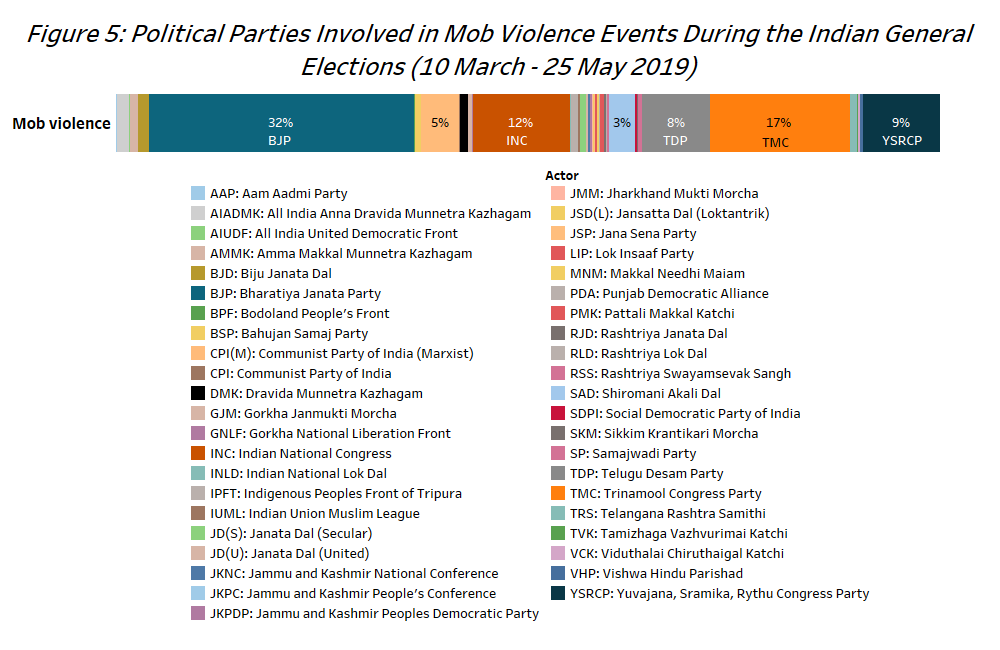
Figure 5 below shows the violent involvement of political parties in mob violence events during the general election. Again members of the BJP (in teal) and TMC (in orange) were most active, followed by members of the Indian National Congress (INC, in brown) and the Yuvajana, Sramika, Rythu Congress Party (YSRCP, in navy). YSRCP is a regional political party in the state of Andhra Pradesh, while the other three actors are national level parties. However, electoral violence involving TMC supporters is centered in West Bengal, where the party controls the state government and is engaged in a bitter political rivalry with opposition parties, especially the BJP.
IV. Conclusion
The 2019 general elections have been a success story in many ways. There was a new record voter turnout of 67.11% (NDTV, 23 May 2019). Female voter turnout equaled male voter turnout for the first time in India’s history, and more female candidates stood for election – and were elected – than ever before (BBC, 24 May 2019). However, electoral violence remained a significant issue in several Indian states. Militancy and entrenched political rivalries continue to be the main drivers of electoral violence in India. It remains to be seen how the second Modi government will address these various national security concerns, and how they will work together with other regional and national political parties to pave the way for India’s continued growth.
© 2019 Armed Conflict Location & Event Data Project (ACLED). All rights reserved.

