1 in 8 people
are estimated to have been exposed to conflict so far in 2024
i
A population is classed as exposed if it is within 5km of a political violence event
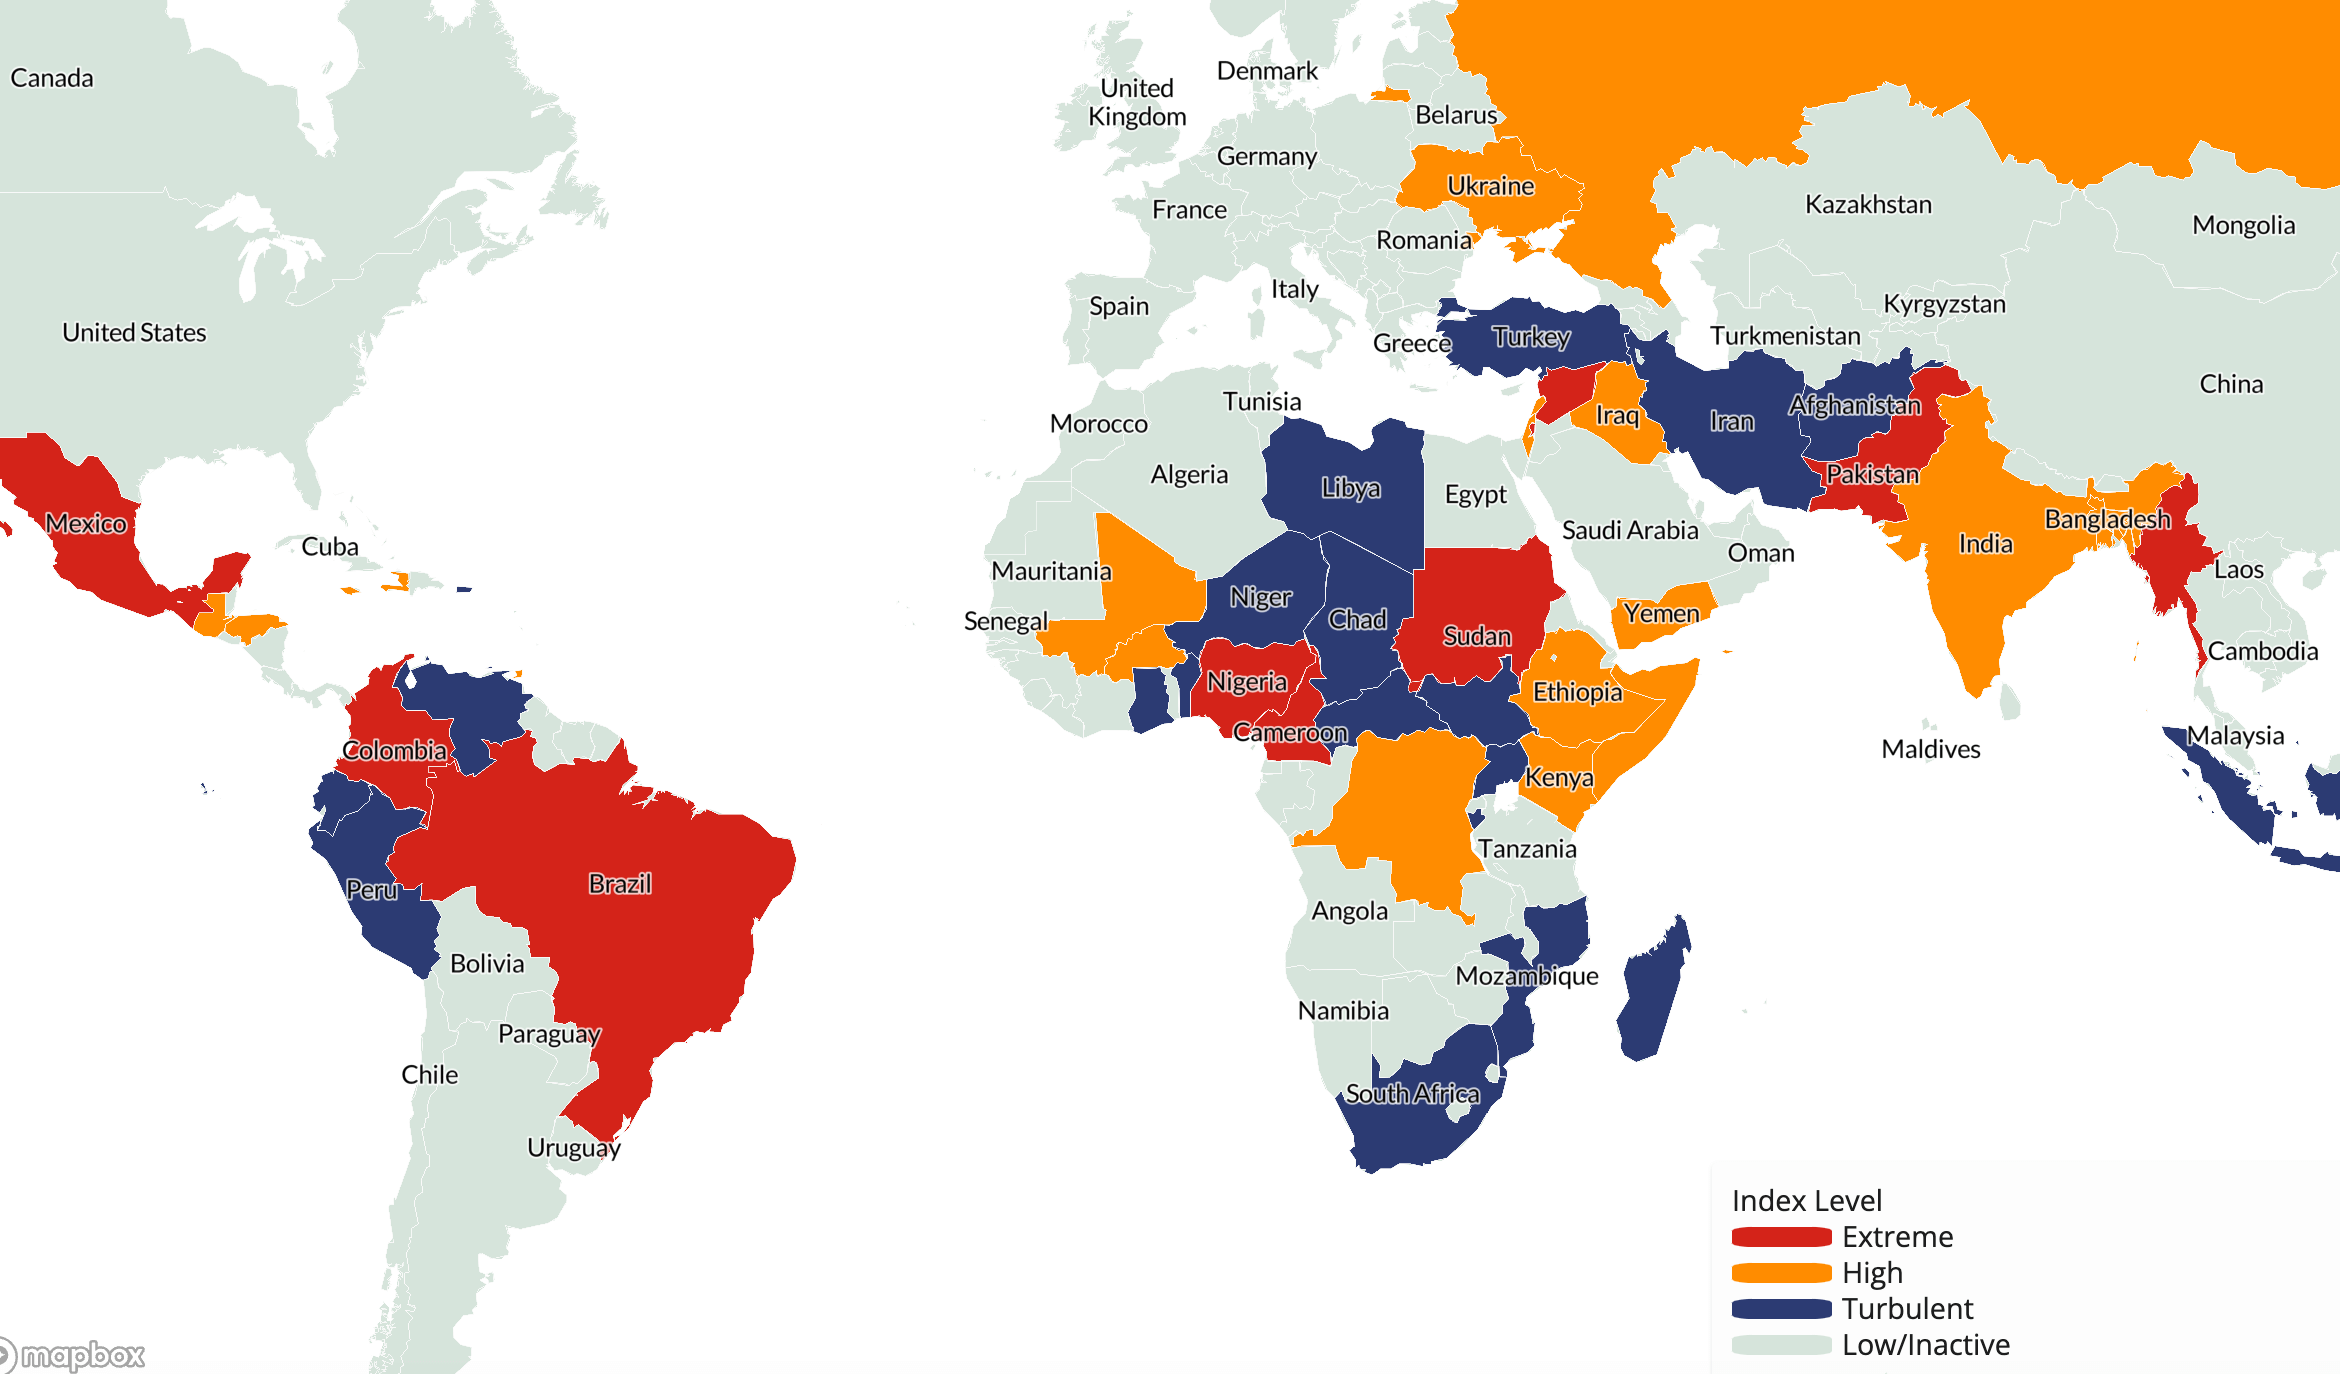
50 countries
rank in the Index categories for extreme, high, or turbulent levels of conflict
i
All countries receive an Index score and 50 meet the top three categories
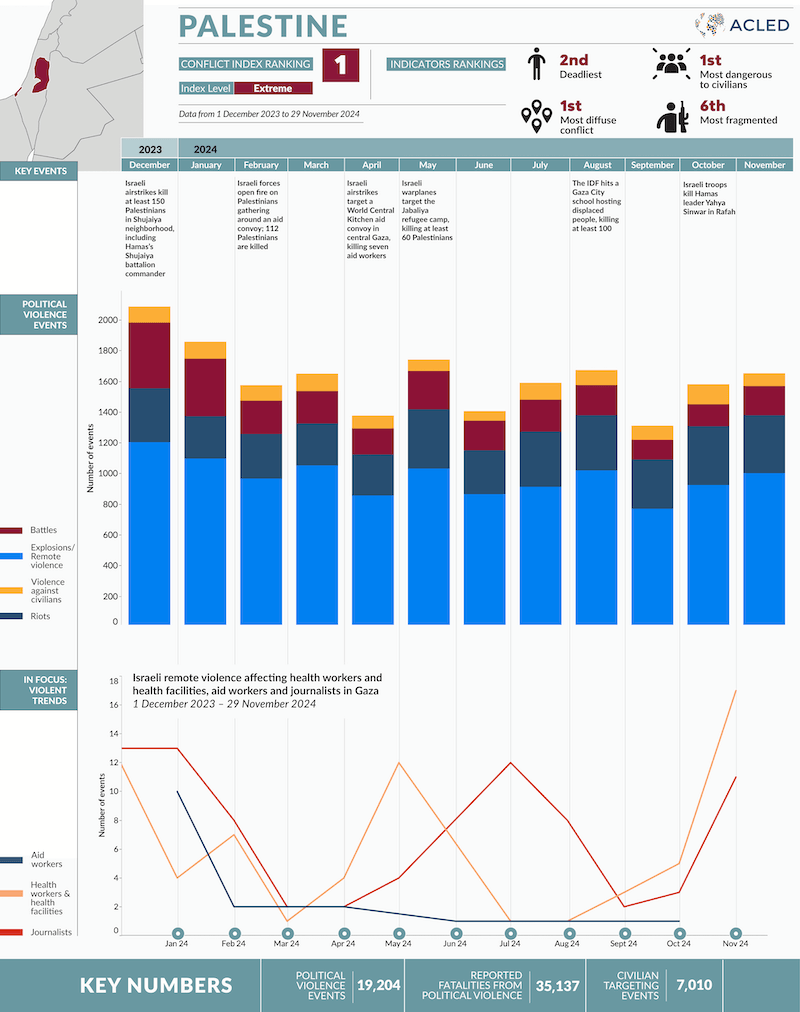
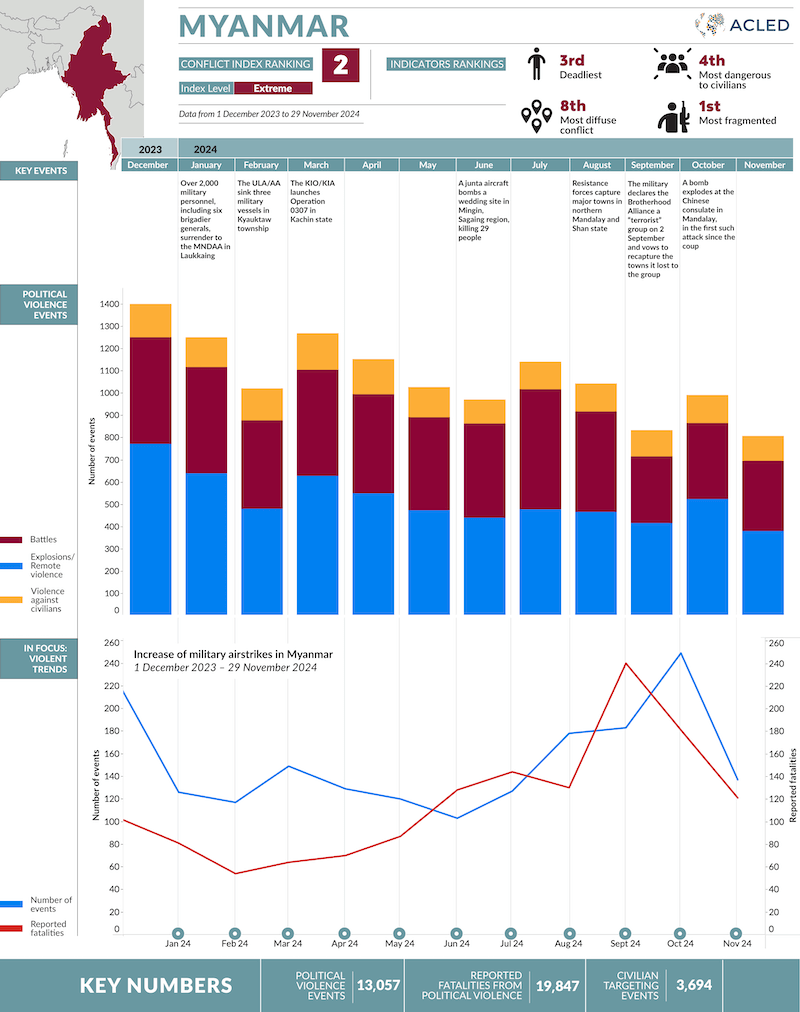
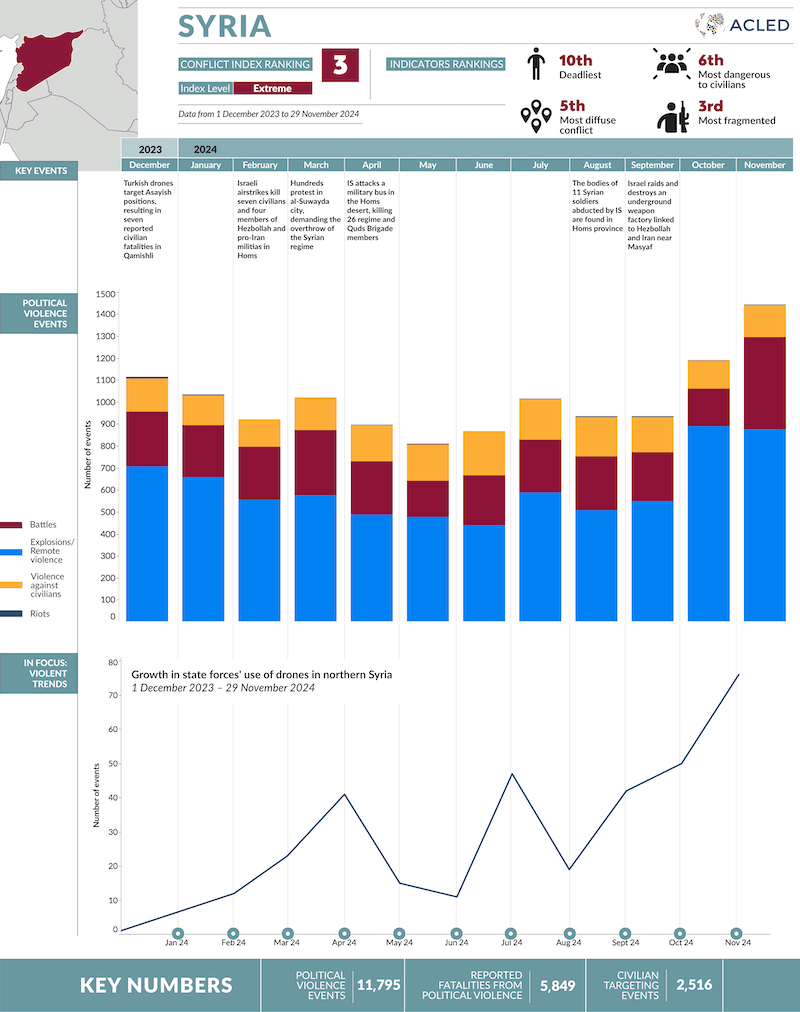
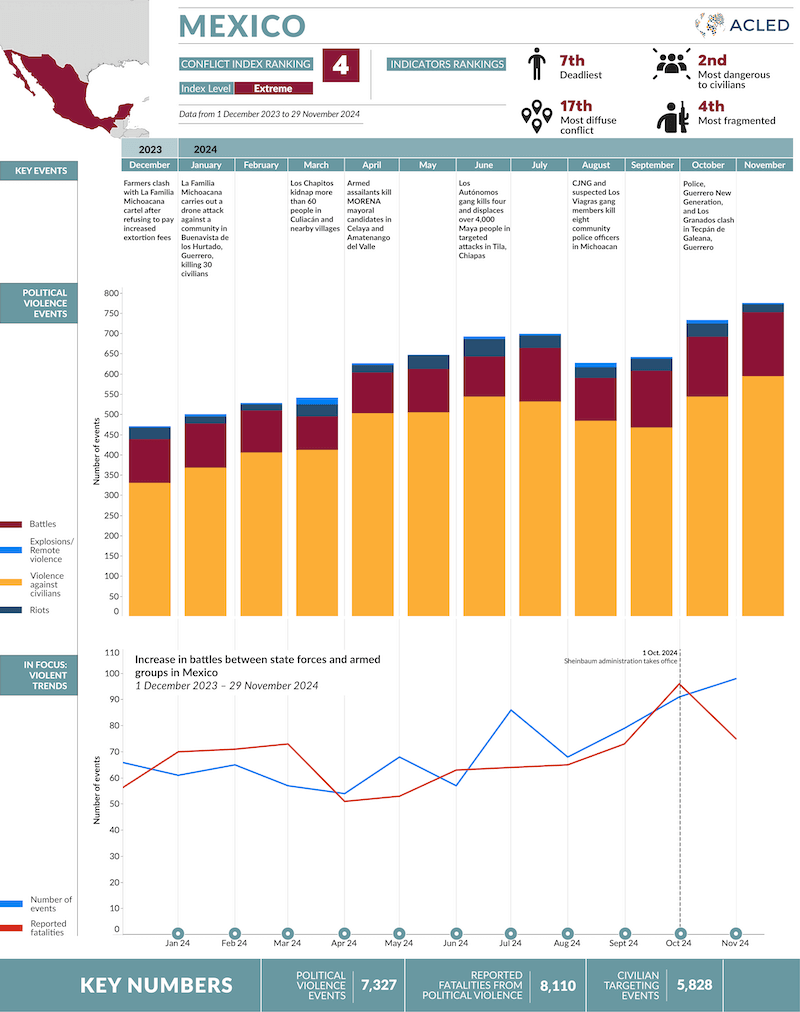
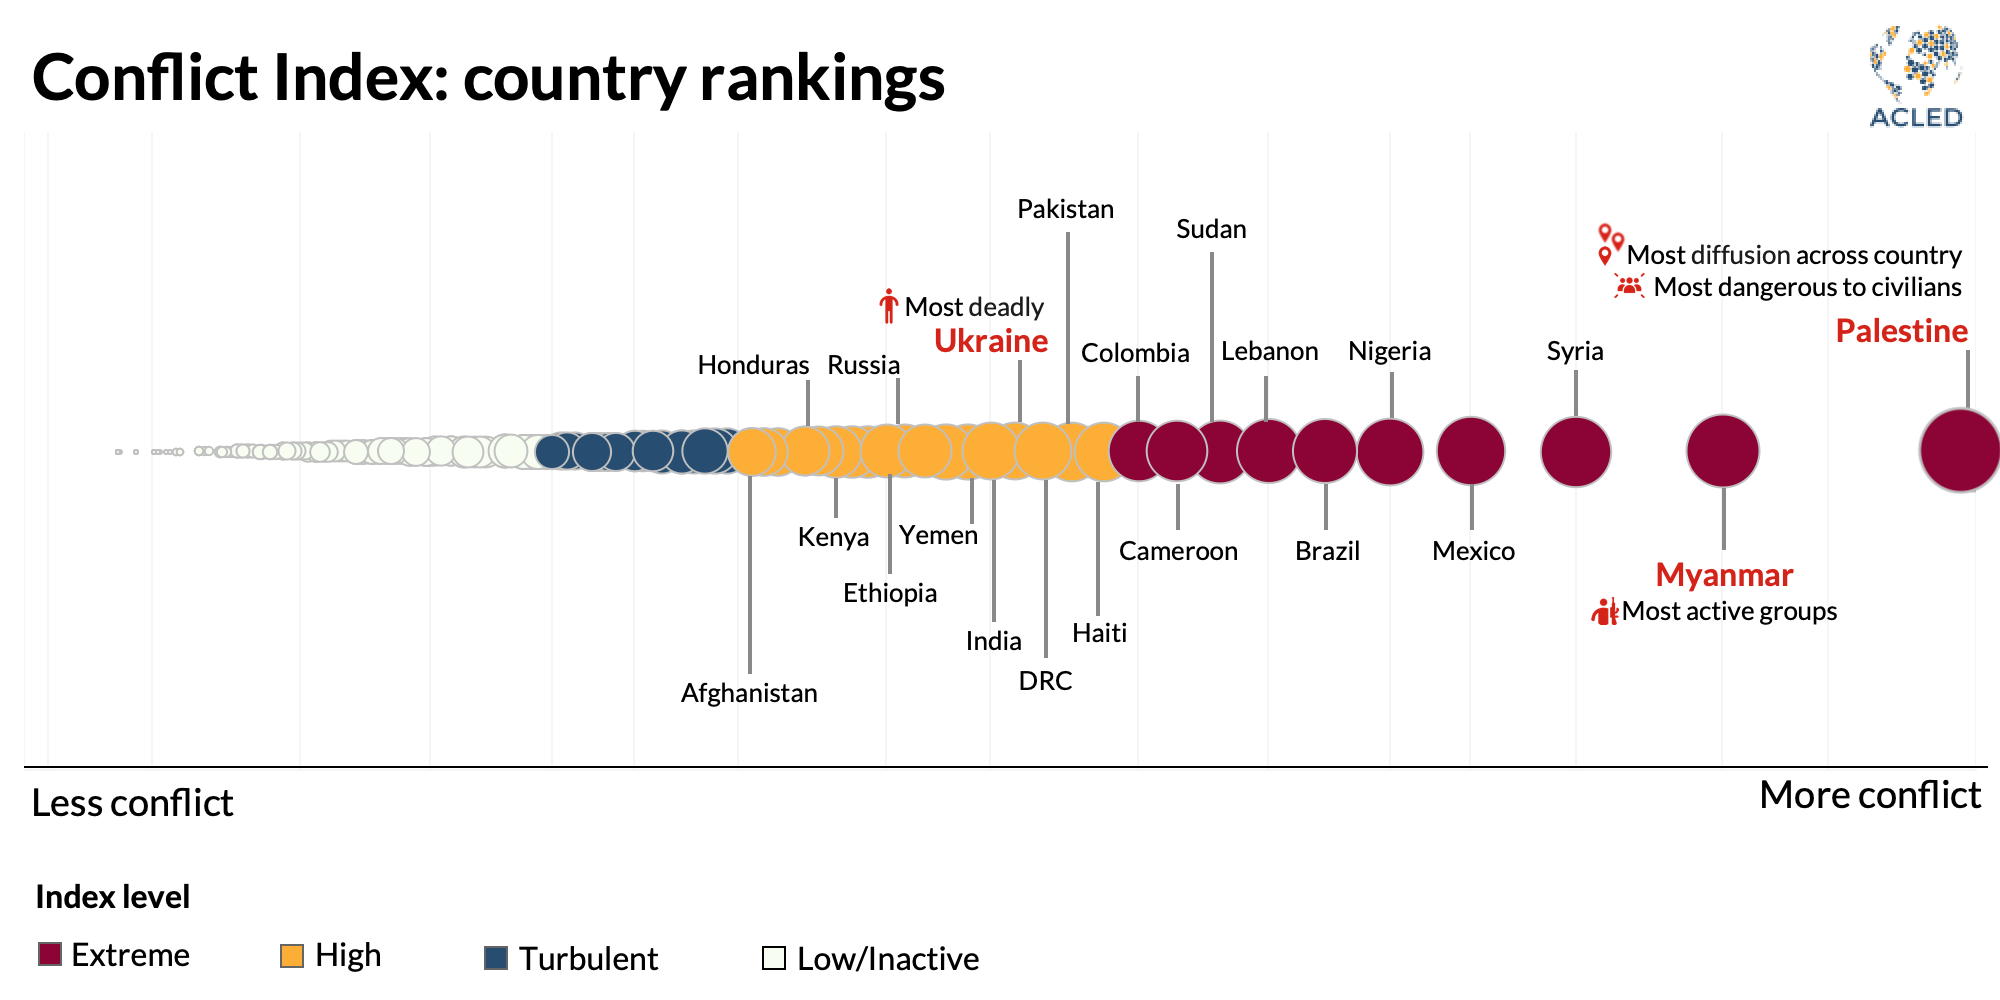
Palestine, Myanmar, Syria, and Mexico
hold the highest positions in the Index
i
25% increase
in political violence incidents recorded in the past 12-month period
i
Over 194,000 political violence events were recorded worldwide from December 2023-November 2024
Click for more information about the Conflict Index, including methodology and past reports.
Watch the recorded launch of our ACLED Conflict Index & 2025 Watchlist
Read our 2025 Conflict Watchlist for a forecast of the upcoming year.
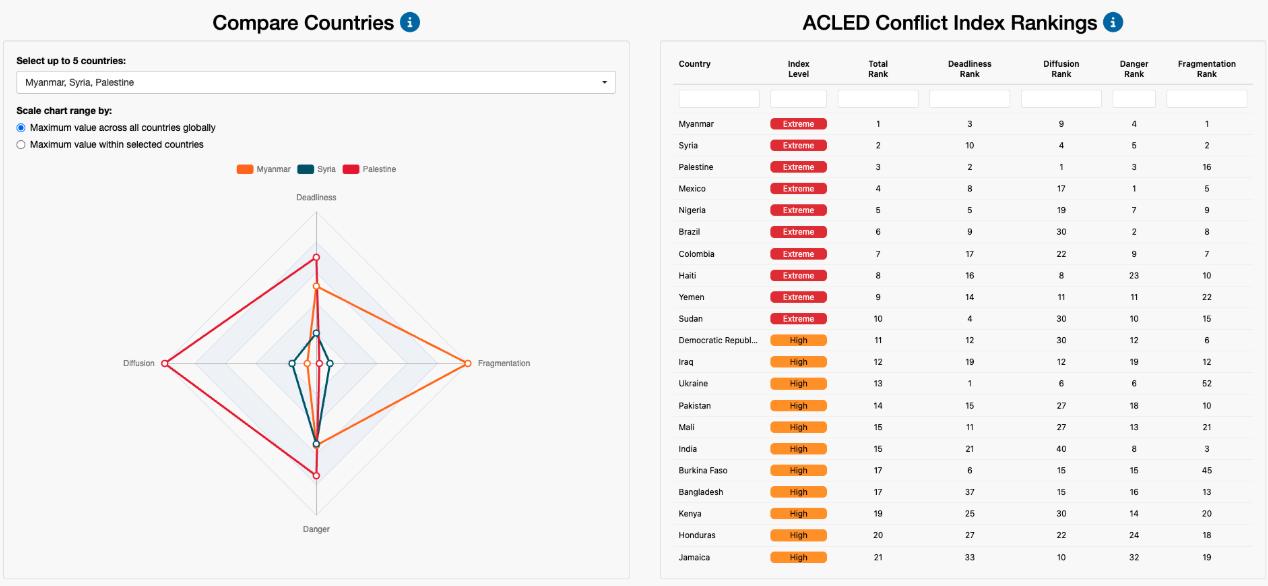
The ACLED Conflict Index calculates where conflicts in every country and territory in the world vary according to four indicators – deadliness, danger to civilians, geographic diffusion, and the number of armed groups.
Using political violence event data of the past twelve months, the ACLED index uses the four indicators of deadliness, danger, diffusion and group fragmentation to identify the country or territory with the highest score on the individual indicators, as well as the top 50 countries and territories experiencing extreme, high, or turbulent levels of conflict as a combined score on the four indicators.
Palestine is the most dangerous and violent place in the world in 2024.
81% of Palestine’s population is exposed to conflict, 35,000 fatalities are recorded in the past 12 months (over 50,000 since Hamas’ attack on 7 October 2023), and civilians remain under daily assault from bombings and incursions. On average, 52 conflict incidents occur in Palestinian territories per day.
Because of Palestine’s — and specifically Gaza’s — level of violence compared to other conflicts and the lack of a ceasefire between combatants, it is very likely to continue being an intense conflict into 2025.
While Palestine had the most dangerous and diffuse conflict in 2024, in Myanmar, an average of 170 distinct non-state armed groups were active each week, and the groups changed quite frequently. Ukraine remained the deadliest conflict.
Where is conflict happening as of December 2024?
Click on the columns to sort the results.
| Rank | Country | Index Level | Change Category | Change Rate |
|---|---|---|---|---|
| 1 | Palestine | Extreme | Consistently concerning | 0 |
| 2 | Myanmar | Extreme | Consistently concerning | 0 |
| 3 | Syria | Extreme | Consistently concerning | 0 |
| 4 | Mexico | Extreme | Consistently concerning | 0 |
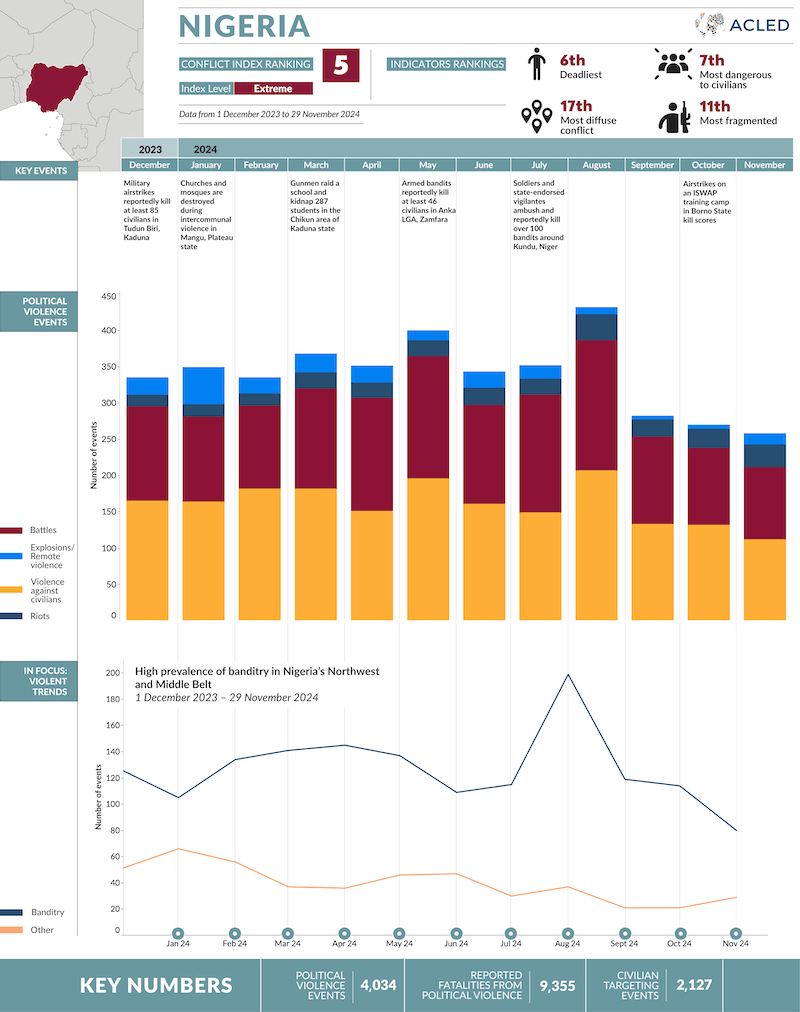
| 5 | Nigeria | Extreme | Consistently concerning | 0 |
| 6 | Brazil | Extreme | Consistently concerning | 0 |
| 7 | Lebanon | Extreme | Worsening | |
| 8 | Sudan | Extreme | Consistently concerning | 0 |
| 9 | Cameroon | Extreme | Consistently concerning | 0 |
| 10 | Colombia | Extreme | Consistently concerning | |
| 11 | Haiti | High | Consistently concerning | |
| 12 | Pakistan | High | Improving | |
| 13 | Democratic Republic of Congo | High | Consistently concerning | |
| 14 | Ukraine | High | Consistently concerning | |
| 15 | India | High | Consistently concerning | |
| 16 | Yemen | High | Consistently concerning | |
| 17 | Iraq | High | Consistently concerning | |
| 18 | Bangladesh | High | Consistently concerning | |
| 19 | Russia | High | Consistently concerning | |
| 20 | Ethiopia | High | Consistently concerning | |
| 21 | Somalia | High | Consistently concerning | |
| 22 | Mali | High | Consistently concerning | |
| 23 | Kenya | High | Consistently concerning | |
| 24 | Jamaica | High | Consistently concerning | |
| 25 | South Sudan | High | Worsening | |
| 25 | Honduras | High | Consistently concerning | |
| 27 | Venezuela | High | Worsening | |
| 28 | Burkina Faso | High | Consistently concerning | |
| 29 | Afghanistan | High | Worsening | |
| 29 | Philippines | High | Consistently concerning | 0 |
| 31 | Trinidad and Tobago | Turbulent | Improving | |
| 32 | Israel | Turbulent | Improving | |
| 33 | Burundi | Turbulent | Consistent | |
| 34 | Puerto Rico | Turbulent | Consistent | 0 |
| 35 | South Africa | Turbulent | Consistent | |
| 35 | Guatemala | Turbulent | Improving | |
| 37 | Niger | Turbulent | Consistent | |
| 38 | Central African Republic | Turbulent | Consistent | |
| 39 | Libya | Turbulent | Consistent | |
| 40 | Mozambique | Turbulent | Consistent | |
| 40 | Indonesia | Turbulent | Consistent | |
| 42 | Ecuador | Turbulent | Consistent | |
| 43 | Peru | Turbulent | Consistent | |
| 44 | Turkey | Turbulent | Consistent | |
| 45 | Uganda | Turbulent | Consistent | |
| 45 | Benin | Turbulent | Consistent | |
| 47 | Madagascar | Turbulent | Consistent | |
| 48 | Ghana | Turbulent | Consistent | |
| 49 | Iran | Turbulent | Consistent | |
| 50 | Chad | Turbulent | Consistent |
Notable trends
How much conflict is occurring in the world?
In the past five years, conflict levels have almost doubled. For 2020, we recorded 104,371 conflict events; this year, for the same period, nearly 200,000.
Over 233,000 deaths is a conservative estimate of reported fatalities resulting from these events in the past year.
This is largely due to three very large conflicts beginning or restarting during that time — Ukraine, Gaza, and Myanmar — coupled with continued violence in many other countries with high rates of conflict — including Sudan, Mexico, Yemen, and Sahel countries, and very few conflicts ending. Civilian exposure to violence, conflict incidents, and the number of armed groups involved in violence are proliferating.
2024 had a 25% increase in political violence events compared to 2023, similar to the average level of increase year-on-year since 2020.
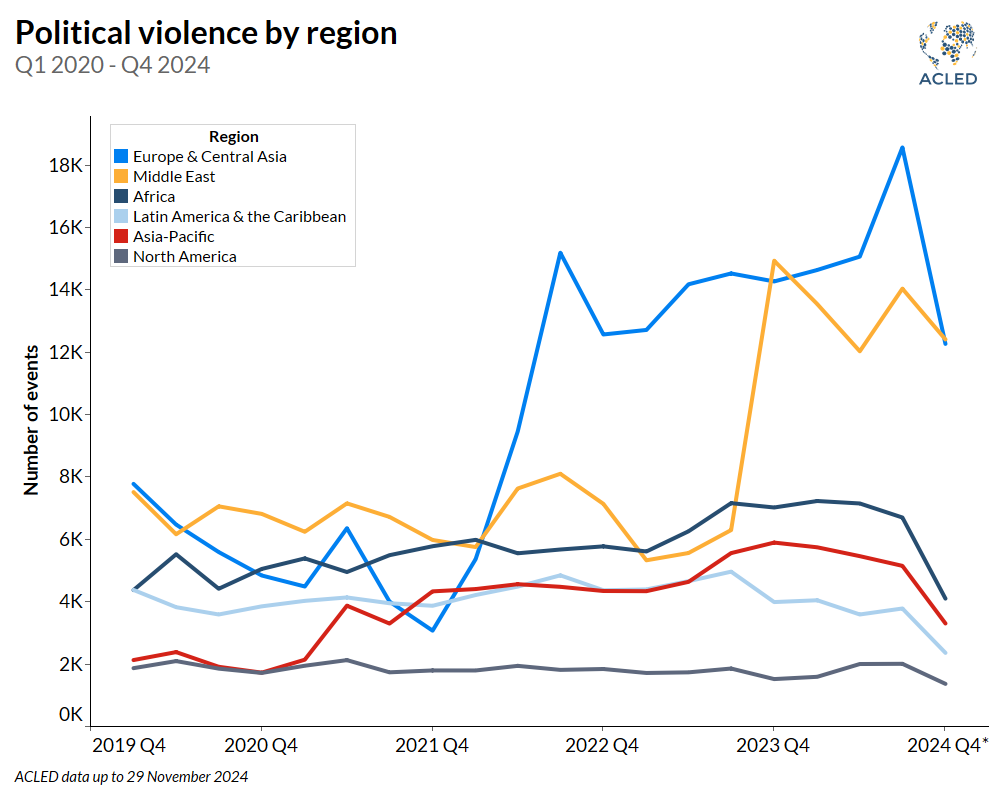
All forms of conflict events have increased.
But bombings now represent over 90,000 events in 2024, are close to double the rate of battles, and triple the rate of direct violence against civilians. As states engage more with challengers domestically and internationally, warfare has become more sophisticated and widespread. Bombing and ‘remote violence’ nearly doubled as of 2022, growing by over 25% per annum since 2022.
Most protests are not included in the Index, but over 143,000 protests occurred in 2024, and major protest movements were linked to pro-Palestine agendas.
In 2024, over 3 billion people across 70 countries went to the polls to vote in national elections, with many more casting their ballots to elect local representatives. Over a third of the countries where a national election was held this year experienced at least one act of electoral violence, affecting authoritarian and unstable states as well as established democracies.
Did the countries with elections experience a notable increase in conflict rates?
Generally, yes: Countries with elections in 2024 had — on average— a 63% increase in national political violence compared to over 21% increases across countries without elections. Increases in violence occur when governments or political opposition groups are willing to use violence to remain in power or seize it when they believe that the vote has been rigged. Political interests then arm militias and mobilize their supporters well before election day. Post-election, countries often return to their pre-election disorder rate.
Yet, electoral violence is not overly effective: Election results in countries like India and Senegal — where incumbent governments lost their absolute majority and presidency despite widespread violence — suggest that violence does not stop democratic choice and change.
But the patterns of conflict overall confirm that living in a democracy is not insurance against conflict. Most conflict is not occurring in ‘poor’ or ‘isolated’ autocratic states but in ‘partially free’ countries.
Most conflict is also now occurring in middle-income countries, and it is growing more strongly in middle- and high-income countries. In short, more development and democracy do not constrain violence. Conflict adapts to political circumstances, changing form and direction according to perpetrators’ agendas.
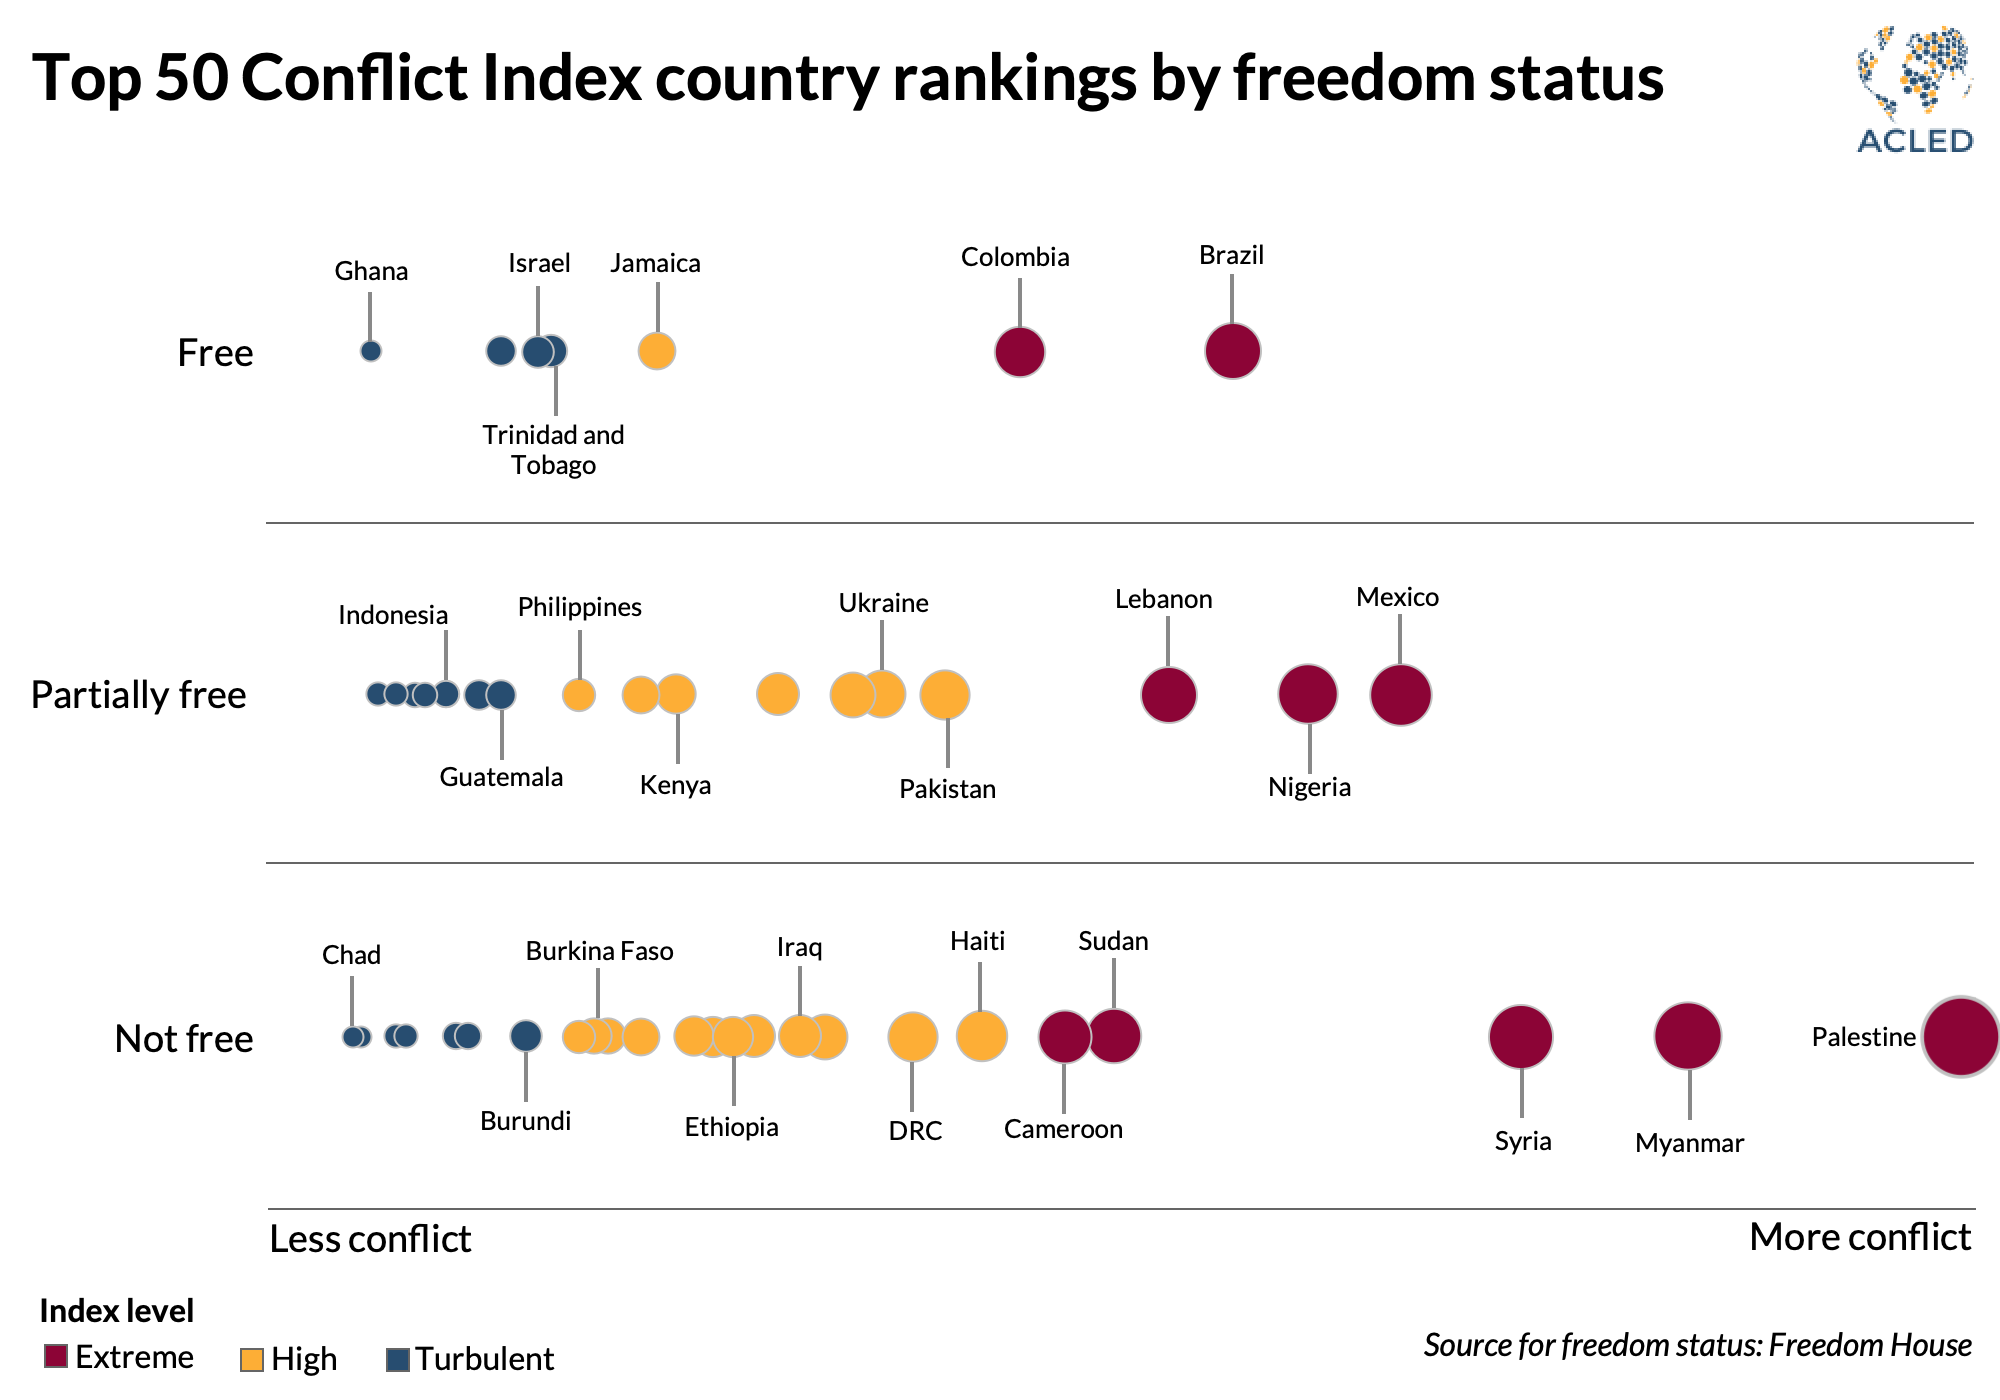
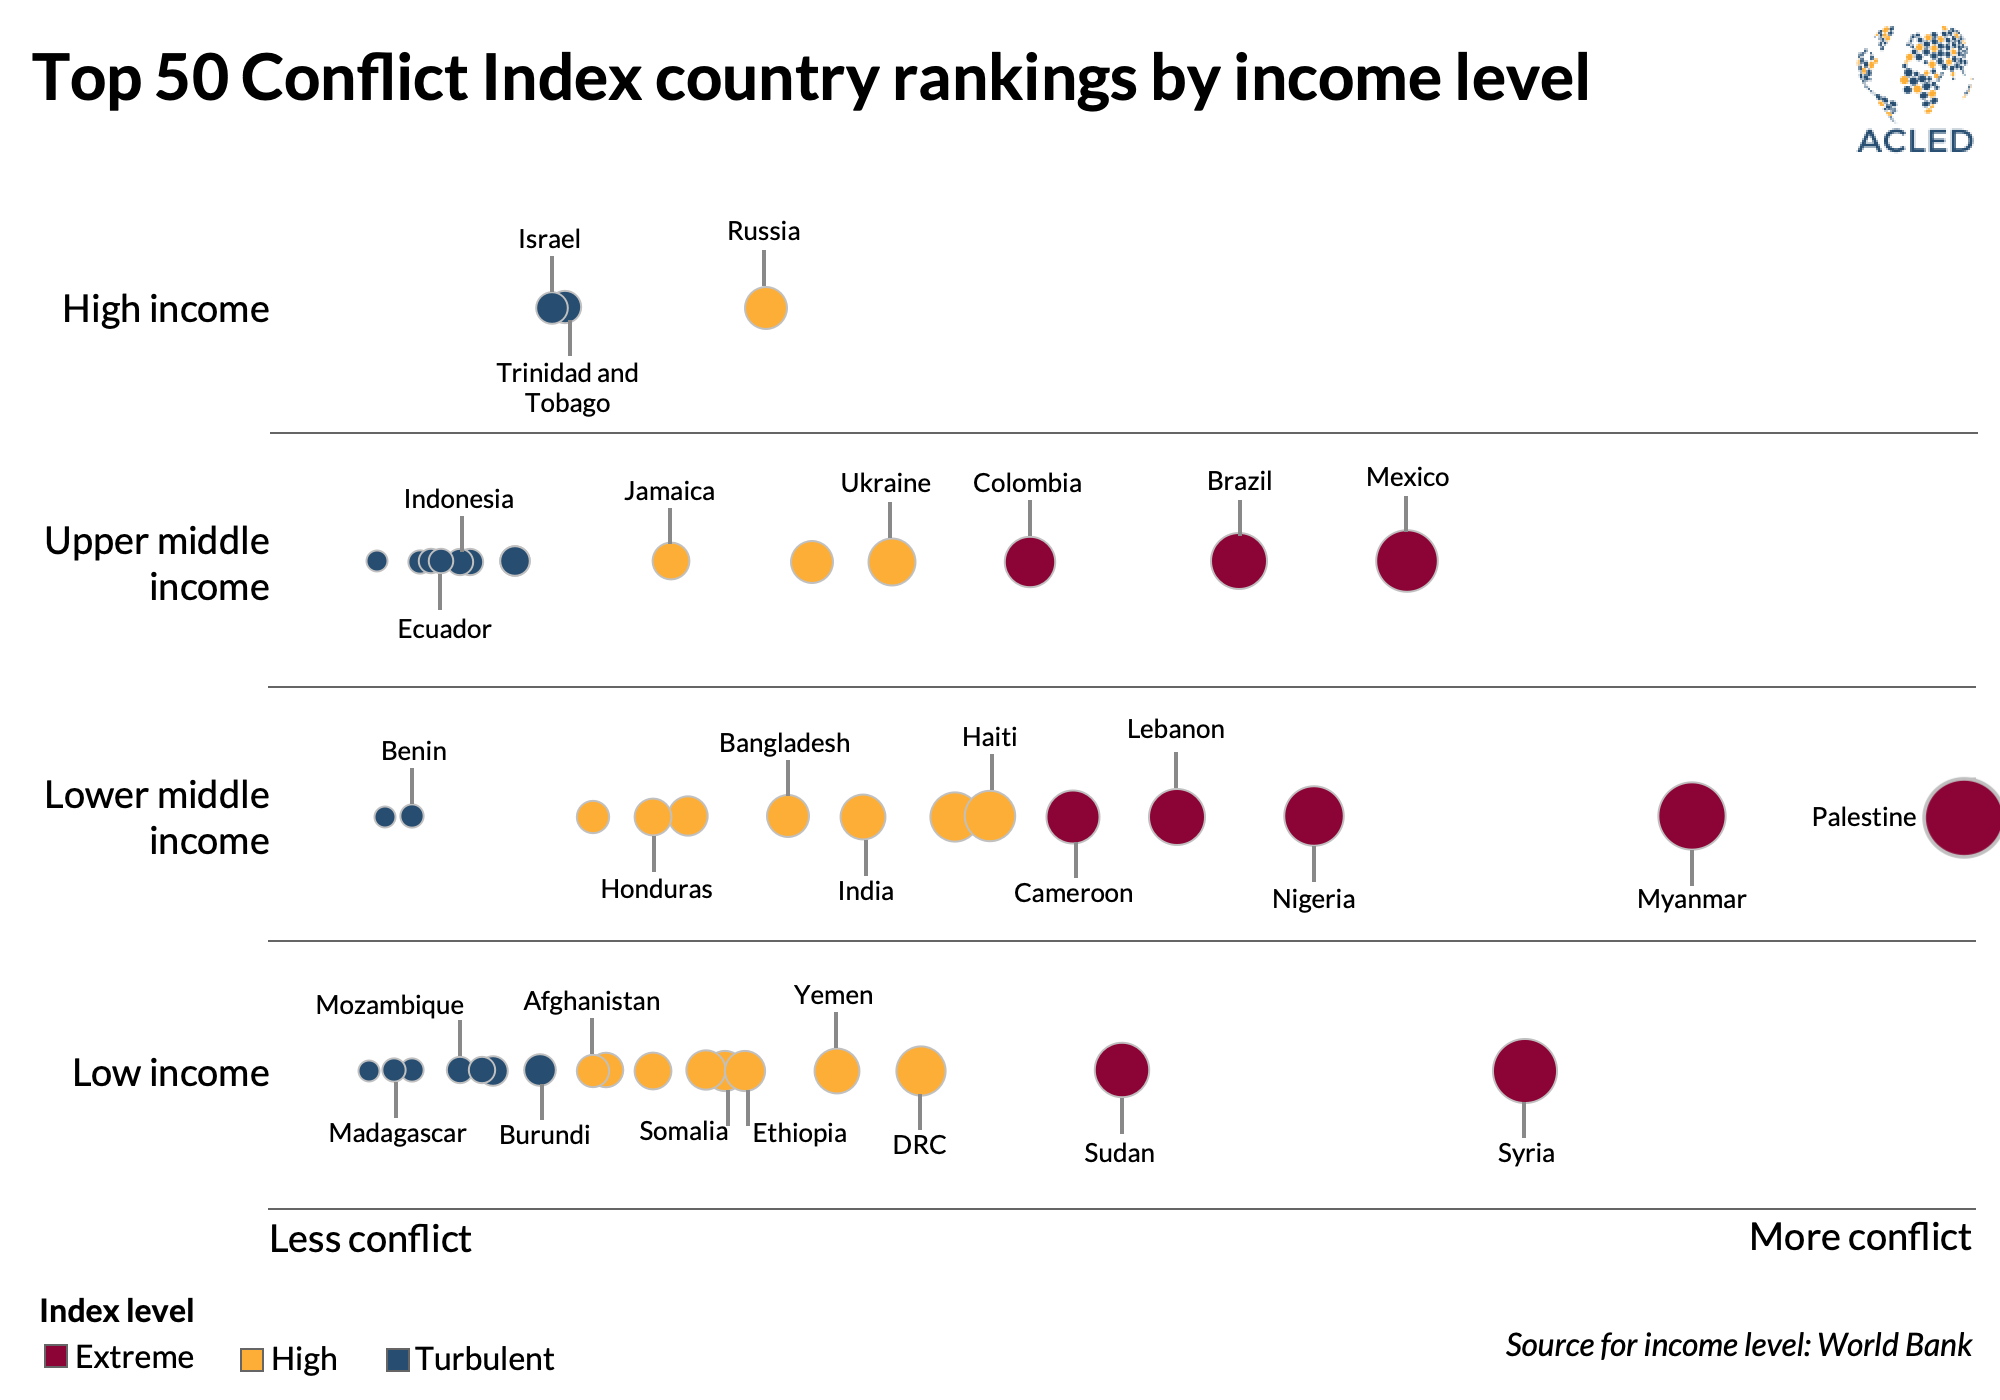
Movement around the Index
Over the course of 2024, Lebanon rose significantly in the Index, entering into the ‘extreme’ list, whereas it previously had hosted ‘high’ levels of conflict. Libya and Peru have also become worse, both because of increases in fatalities as a result of political violence. Levels of violence overall declined in Yemen despite remaining a site of very high conflict levels. Yemen has decreased consistently year-on-year — from more than 10,000 in 2020 to just over 2,000 in 2024 — but its violence is expanding into new areas and against new competitors in the Red Sea.
Haiti has approximately double the number of events in 2024 compared to 2020 but reported fewer fatalities in the past year.
Despite fears that the United States’ election year would result in a surge of violence, the US is no longer ‘turbulent.’ The US election was covered in great detail in our Crisis Monitor, and while pro-Palestinian protests were very popular across the US, militant and violent movements were massively overpredicted by the media, and significant violence did not occur.
Violence patterns are varied across the Index’s extremely conflicted countries.
The most violent places are experiencing quite different conflict types: From bombing campaigns across the Middle East, mob violence in India, a cartel civil war in Mexico, internal jihadi competition coupled with (formerly Wagner) mercenaries in the Sahel, Red Sea antagonisms, an inter-state stalemate in Ukraine, to Sudan’s violence upon civilians.
Communities and governments can be equally and deeply challenged by multiple gangs that extort, build illicit economies, kill civilians, and destroy public space and politics, as they are by an established insurgent group with a hierarchical military structure and national political agenda. Each form of conflict is detrimental and widespread, resulting in a larger share of the global population being exposed to continued political violence.
The conflicts that proliferated in 2024 starkly demonstrate the differences between being in power and being in control. In the Sahel, governments in Mali, Burkina Faso, and Niger are in power but hardly in control of the local areas: Rather, jihadi groups, external mercenaries, and local arrangements create a chess board of control and competition. Governments in Myanmar, Mexico’s new president, and Israeli Prime Minister Benjamin Netanyahu’s coalition are all running into the abyss of ‘control vs. power.’ The results are drastic increases in violence rates and more violent groups, while influence over how violence evolves and ends is elusive.
2025: What to expect
Recent levels of violence have been unprecedentedly high, with several ‘record breaking’ months in the past year. What can we expect in 2025? In the beginning of 2025, conflict event rates are expected to grow by 15% due to more bombings and battles, and result in approximately 20,000 reported fatalities per month.1Using ACLED’s CAST warnings
Throughout the year, ACLED will assess whether conflict continues to increase, or whether armed groups will revert to a high, but stable, average rate of violence. This will largely be determined by how specific conflict actors engage in violence across multiple places. The recent activity in Syria is a test case of whether the involvement of external parties (e.g., Iran, Russia, Hezbollah, Turkey) reduces the conflicts these actors are involved in elsewhere.
Throughout 2025, levels of violence are expected to remain very high relative to the recent historical norm, and an annual increase of 20% is likely. However, the places, contenders, and forms of increased conflict in 2025 could be drastically different than the pattern in 2024. ACLED’s CAST will continue to predict conflict patterns throughout the year.
Visit the ACLED Conflict Index home page for more information and previous reports.
Downloads & Tools
Access a data file with ACLED Conflict Index results for all countries and territories, including Index level, overall Index ranking, and each individual Index indicator score. To access the underlying ACLED conflict data, use our data export tool or curated data files.
Interactive Conflict Index Dashboard
For more information about past and present Index results, use our interactive dashboard to access additional tools, resources, and data downloads. Use of the tool requires registration for a free account.

