Many have noted inequality as fuel for conflict (see review in Lichbach, 1989). It can serve to exacerbate grievances amongst those who have less-than within unequal contexts, which can in turn serve as a mobilizing factor in fueling violence (Stewart, 2008). Alternatively, it can make the ‘prize’ of conflict larger – within the most unequal societies, the poor have less to lose and more to gain – which makes conflict increasingly likely (Collier & Hoeffler, 2004).
Using conflict data from the Armed Conflict Location and Event Data (ACLED) project for 2014 and 2015, and inequality data from the World Bank Development Indicators, the effect of inequality on future conflict and violence in Africa is explored here through mapping the geographic locations of all political conflict in Africa over maps of various inequality measures.
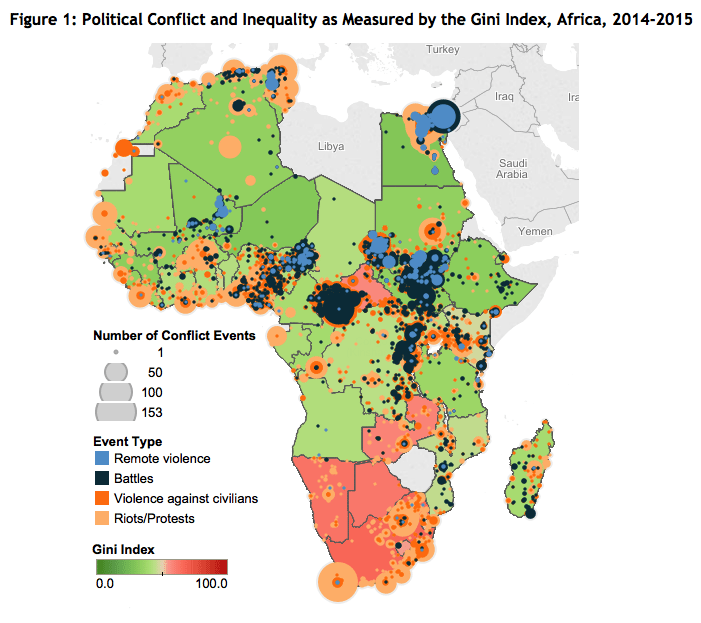
Figure 1 maps the effect of inequality as measured by the Gini Index on political conflict. “[The] Gini index measures the extent to which the distribution of income or consumption expenditure among individuals or households within an economy deviates from a perfectly equal distribution (World Bank, 2015). A Gini index of 0 (green) represents perfect equality (i.e., where everyone has the same income), while an index of 100 (red) implies perfect inequality (i.e., where one person has all the income, and everyone else has 0 income). Numerous studies argue that increased inequality results in increased violent conflict (see review in Lichbach, 1989). In line with this, there are examples of states – such as the Central African Republic – where inequality is high that do indeed exhibit very high levels of conflict. However, the index suggests that inequality within states across much of the continent is not very high – a finding which would refute the inequality-breeds-conflict argument given the extent of conflict across the African continent. Indeed, in Southern Africa–where inequality is highest–most instability is experienced as riots and protests instead of coordinated armed movements. The societal and political conditions that are associated with riots and protests being the main form of instability are also correlated with fewer episodes of armed group emergence and action. Therefore the relationship between inequality and armed conflict is mediated through the state’s level of economic and political development.
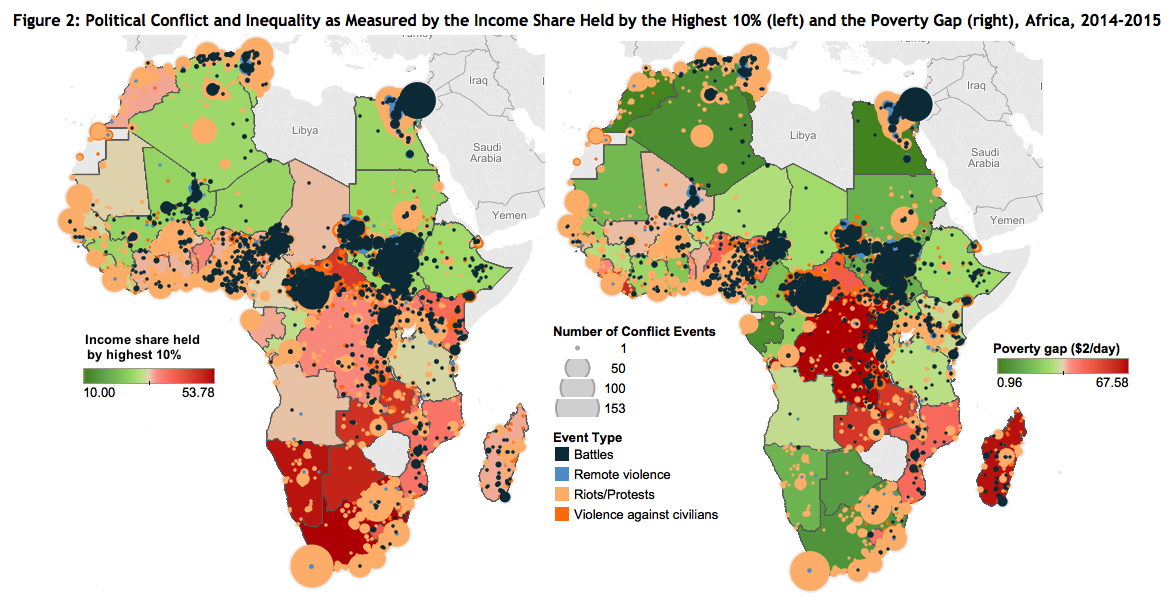
Indicators used to measure facets of inequality can play a large role in how inequality is perceived. Figure 2 compares the effect of inequality on political conflict when measured as the share of income held by the highest 10% (i.e. income/consumption that accrues to the highest 10% subgroup of the population, based on deciles) on the left versus when measured as the poverty gap (i.e. a measure of the mean shortfall from the poverty line – expressed as a percentage of the poverty line). The non-poor – who live above the poverty line – have zero shortfall) on the right. This latter measure reflects the depth of poverty as well as its incidence. A number of studies argue that a primary reason behind the rate of conflict in Africa is poverty (for example, see Elbadawi & Sambanis, 2000; Collier & Hoeffler, 2002; Fearon & Laitin, 2003). On the left, given perfect equality, the top 10% of the population would hold 10% of the income; hence, higher scores (red) denote that the top 10% of the population holds an increasingly larger proportion of income, suggesting greater inequality. On the right, higher scores (red) denote a greater shortfall, while lower scores (green) denote a lesser shortfall.
In line with studies that find that inequality breeds conflict, high levels of conflict are found in unequal places according to these measures of inequality. However, failures by both measures in explaining the relatively high rate of conflict in places such as Sudan and South Sudan – where the highest 10% hold a relatively low share of the income, and a smaller proportion of the population lives below the poverty line (relative to other African states) – or the relatively low rate of conflict in places such as Benin and Togo – where again the highest 10% hold a relatively high share of the income, and a larger proportion of the population lives below the poverty line (relative to other African states) – highlights potential issues in using these measures in explaining conflict occurrence.
Further, differences in the categorization of inequality within certain states by the measures also illuminate the issues with using proxy indices to measure more complex issues. For example, while the highest 10% hold a relatively low share of the income in Mali and Liberia (see states in green on map on left), large(r) proportions of the populations of these states fall short of the poverty line (see states in red on map on right). Or, while the highest 10% hold a relatively high share of the income in Kenya, Botswana, Namibia, and South Africa (see states in red on map on left), large(r) proportions of the populations of these states do not fall short of the poverty line (see states in green on map on right).
Numerous studies argue for a link between inequality and obstacles in attaining successful development, contending that mitigating unfairness within societies is crucial in minimizing potential conflict in these regions – which can itself be a barrier in reaching development goals. Inequalities amongst groups within societies (horizontal inequalities) may be more of an impetus for conflict than inequalities amongst individuals (vertical inequalities) – as measured by the various indices here (for example, see an earlier blog post on this topic). “‘Horizontal inequalities’, or inequalities that coincide with identity-based cleavages, … may enhance both grievances and group cohesion among the relatively deprived and thus facilitate mobilization for conflict (Øtsby, 2008, p.143).
This report was originally featured in the September ACLED Conflict Trends Report.
AfricaCivilians At RiskCurrent HotspotsInequalityPovertyRemote ViolenceRioting And ProtestsViolence Against Civilians


